Summer School First Announcement

 WORKSHOP_slider

NATO – MODUM summer school in underwater munitions
Summer school will take place in Halifax | Canada | from 27th June to 1st July 2016.

Summer School will be conducted in Halifax, Canada by IDUM in Cooperation with Dalhausie University. Predicted participation is ca. 40 persons, including teachers. The summer school will last 5 full days, and cover all project activities, based on existing work packages.

Preliminary Programme for 5 Days:

Day 1
Introduction to the project and overview of methods, risks.
What is monitoring?

Day 2
Fieldwork: Survey/ Identification of objects.

Day 3
Fieldwork: Sampling, in situ measurements, Chemical measurements on board

Day 4
Data Analysis + Modelling

Day 5
Modelling + Assessment, ½ day for student presentations.

Follow our Facebook page for more details!


Meeting in Sandbjerg


4th Project Meeting

The fourth project meeting was convened at Sandbjerg, Denmark in days from 26 to 27 October 2014.

The project was organized by the Danish project Co-director Prof. Hans Sanderson. Following Agenda was adopted:

The meeting was attended by project partners from AU, IOPAS, VERIFIN, FOI and IORAS.

Project progress was presented, and preparation of 4th interim report was discussed with co directors.


Project progress

AU has presented toxicity results. Several important data  is generally missing in the literature – mainly on the chronic toxicity , and both acute and chronic toxicity of cyclic degradation products of mustard gas. Hence, AU is continuing to fill this gap. Discussion regarding which specific compounds to be  tested took place.

There is a need to review  the usefulness of biomarkers specific for degradation products of CWA – and existing biomarkers have to be evaluated. EROD is showing some theoretical potential, while AChEsuitability has been questioned as this is specific for e.g. organophosphate compounds (e.g. Sarin or VX), which are rarely found due to rapid hydrolysis of these.

Very beneficial for the project would be the analysis of actual lump of mustard gas from the dumpsite. AU promised to investigate the possibility in DK , while VERIFIN and FOI expressed analytical interest, from their own funds if necessary.


Hydrographical measurements

A number of measurements was done, but mostly from shipboard. For the full suitability of mooring study there is a need for extra measurements in Słupsk Furrow. IORAS will contact FI regarding possibilities of participation in Walther Herwig III cruise, while IOPAS will investigate possibilities of IORAS participation in Winter “Oceania” cruise. At the same time IOPAS will investigate charter price of m/s “Doktor Lubecki” for IORAS, which will use the money from Cruises budget line for this vessel’s charter instead of using their own ship Nord II, which is currently under repairs.

AUV/ROV Suitability study

Oncoming deliverable, AUV/ROV suitability study was discussed.

Suitability study will be based on several parameters:

  1. Sonar – performance of sonar for detection of underwater objects will be compared. Comparison between towed array and AUV based sonar will be based on data from IOPAS towed sonar, LEPA towed Sonar and IVER. LEPA and IOPAS will have to compile precision of navigation and resolution of their instruments, based on data from MODUM and any other projects – i.e CHEMSEA. The performance of each sonar should be max 4 pages long, including pictures. Comparison between AUVs will be done between REMUS and IVER, if possible also including CMRE data.
    This will be done in IOPAS. Data from CMRE will be obtained when portable 2TB hard drive will be completed, in mid November. By this time, agreement for data usage should be signed between CMRE and MODUM. IOPAS will ask for the draft of such agreement next week.
  2. Magnetometer suitability. Performance of AUV based mag and towed instruments will be based on IVER data and towed magnetometer used in previous projects by IORAS. It will be supplemented by data from CMRE cruise obtained by IVER. IOPAS will do that. Additionally, magnetometer calibration will be performed this year next to Sopot jetty. IOPAS and IORAS will produce 4 pages each on magnetometer navigation precision of navigation and resolution. IOPAS will produce additional 3 pages on data post-processing
  3. Environmental parameters collection – comparison between AUV and shipboard sensors. CTD, ADCP mostly, but also O2, pH and redox and turbidity if available. Data from shipboard devices deployed during the MODUM cruises should be analysed by each team that performed cruises, in regard to: precision, vertical resolution, type of collected data, ease of operation. Data from cruises where IVER measured at the same time as shipboard devices should be discussed. In order to do that all such data should be submitted to the Data Center, if not already available there. Discussion should be performed by IOPAS and IORAS teams.

Habitat Paper

The research paper, describing habitats in dumpsites areas was discussed between project partners. Following approach was adopted:

The idea of research paper, describing habitats in dumpsites areas was discussed between project partners. It was decided that the person responsible for data mining and first authorship will be Michal Czub, PhD student from IO PAS. The work includes creating a database of available environmental data at the ofiicial and unofficial dumpsites. This includes also data from other projects, such as MERCW or NordStream. The paper will  provide solid description of the investigated basins and risks.

Weight of evidence

Emission of contaminants is only crudely provided in WoE. This is something, which needs to be solved. Possible approaches are:

Scenarios – pinhole and total loss of containment scenarios could be used. If possible, weights/volume of mustard gas in shells, or as lumps could be used to approximate loss of mass vs. time. AU will investigate if there is any information in the Danish archives regarding such data. Also obtaining Mustard gas lump and performing aquarium experiment would be useful.

Another possibility is back calculations with the model – estimate emission strength based on observed concentration pattern in sediments.

Yet another possibility to evaluate emission is the time series of the same object, or same area concentration – if concentrations are dropping this will be the prove that sources are no longer active.

Exposure status of the Dumpsites

Discussion regarding publication of exposure status of dumpsites was commenced. It was decidsed to work on it Jointly, leader being VARIFIN with IOPAS Support. Draft Structure is attached.

Samples

Sample selection for analysis was postponed, since locations and data need to be reviewed by VERIFIN / FOI prior to decision

List of Participants:

Jacek Beldowski
Project Director
Institute of Oceanology PAS
Sopot
Poland
Anders Oestin
Co-director
FOI, Swedish Defence Research Agency
Umea
Sweden
Algirdas Stankevicius
Co-director
Lithuanian Environemntal Agency
Klaipeda
Lithuania
Paula Vanninen
Co-director
VERIFIN, University of Helsinki
Helsinki
Finland
Vadim Paka
Project Director
Institute of Oceanology, RAS
Kaliningrad
Russia
Hans Sanderson
Co-director
Aarhus University
Aarhus
Denmark
Patrik Fauser
Participant
Aarhus University
Aarhus
Denmark
Morten Swayne Storgaard
Participant
Aarhus University
Aarhus
Denmark
Miłosz Grabowski
Participant
Institute of Oceanology PAS
Sopot
Poland
Michał Czub
Participant
Institute of Oceanology PAS
Sopot
Poland
Maria Golenko
Participant
Institute of Oceanology, RAS
Kaliningrad
Russia
Vitalijus Malejevas
Participant
Lithuanian Environemntal Agency
Klaipeda
Lithuania


Cruises

WP3 starts with the selection of optimal sensors and equipment. This will include Autonomous Underwater Vehicles (AUV) with payload including acoustic sensors and magnetometer, as well as Eco-mapping capabilities and Remotely Operated Vehicles (ROV) equipped with video and acoustic cameras, for objects detection and  identification, and multi sample collection system This task will also select the best equipment for the WP4 Monitoring. Based on experience of co-directors, best equipment will be selected and rented for the test purposes.

Test cruises will be performed in month 6. A test cruise will be performed in cooperation with NATO CMRE Center in the Mediterranean Sea in month 6. An additional test cruise, if needed, will be performed in the Baltic Sea in Month 9. If additional tests are needed, they will be extended in month 9.

Data collected within test cruises will be postprocessed to obtain high quality results, and data will be verified by cross comparison of multiple instruments and position data of targets. Methods developed at this stage will be the base for data handling within the project.

A deliverable of the test cruises will be a suitability report of tested equipment for WPs 3 and 4.

After the report is completed, market research will follow for the final selection of criteria for selected equipment. The deliverable of this stage will be the specification of terms of reference to be used in public bidding (open tender) procedure for purchasing the equipment.

When the equipment is purchased, ships taking part in the project (IOPAS, FI, IORAS and LEPA) will be adjusted to handle AUVs and ROVs operating in the project. This will include modifications of existing infrastructure to suite deployments, retrievals and data collection from devices used in the project.

Mobile Detection developement

Mobile Detection developement (Tallinn University of Technology)


The main research in the last six months (from October 2014 to April 2015) was focused on the following:

  • The optimization (amount of dervatizating agent, derivatizating temperature and heating time) of derivatization procedure of sulfur mustard hydrolysis and oxidation products (thiodiglycol (TDG), TDG sulphoxide (TDGO) and TDG sulphone (TDGOO))
  • The optimization of the separation conditions (buffer pH and concentration, capillary temperature and applied voltage).
  • Validation of capillary electrophoretic separation method with direct UV detection (linearity, precision, LOD and LOQ).
  • Preliminary studies of sediments (spiking of sediments with TDG, TDGO and TDGOO and evaluation of adsorption to the sediment; separation of pore water from sediment)


1)      Optimization of derivation procedure

To obtain reproducible results from the sample derivatization procedure [1], a careful optimization of several reaction parameters, such as the amount of dervatizing agent, the heating time and heating temperature was performed. The effects of the amount of the derivatizating reactant was added, were examined. Each time sample was injected into an electrophoretic system, the average peak area (n =3) was measured and the condition that gave maximum response (peak area) was selected. Based on the stoichiometry of the derivatizing reaction, the required minimum amount of reactant was calculated (~40 µL per 2.5mg of TDG). Then 2-, 3- and 4-fold volume excess of reactant was applied for the derivatization of each analyte. Based on the average peak area measurements, the maximum response was achieved applying the 2-fold volume excess of phthalic mixture. The appearance of the phthalic acid peak on an electropherogram (unreacted phthalic anhydride) acted as an indicator of a sufficient excess of derivatizing reactant.   For future experiments, 100 µL of reactant per each 2.5 mg of analyte was selected to avoid the lack of derivatizing reactant in real samples.


To find the optimal derivatization temperature and heating time, a set of additional experiments was carried out, varying the temperature in a range of 25-85C and the heating time in a range of 0-25 minutes. Keeping the temperature constant (85C, in accordance with the literature source [1]), the maximum response was achieved within 5 minutes (Fig.1A). The effect of the heating temperature was evaluated, keeping the reaction time (20 min) constant. The best response was obtained at 45C and further temperature increases did not affect the result (Fig.1B). Finally, the derivatization conditions were as follows: the amount of reactant – 100 µL of reactant per each analyte, derivatization temperature  45C and derivatization time 20 minutes.

1 2


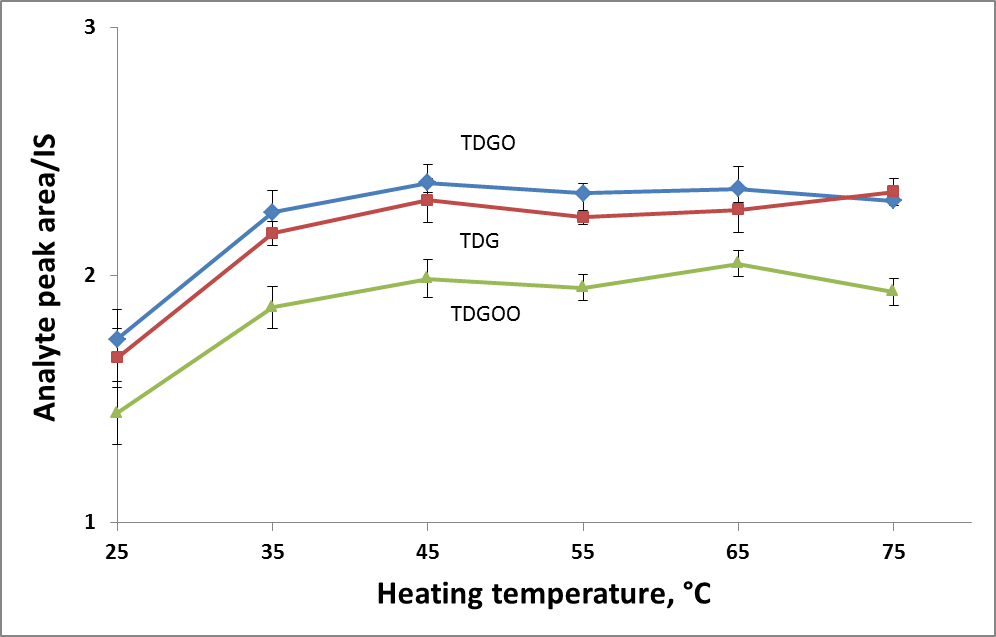
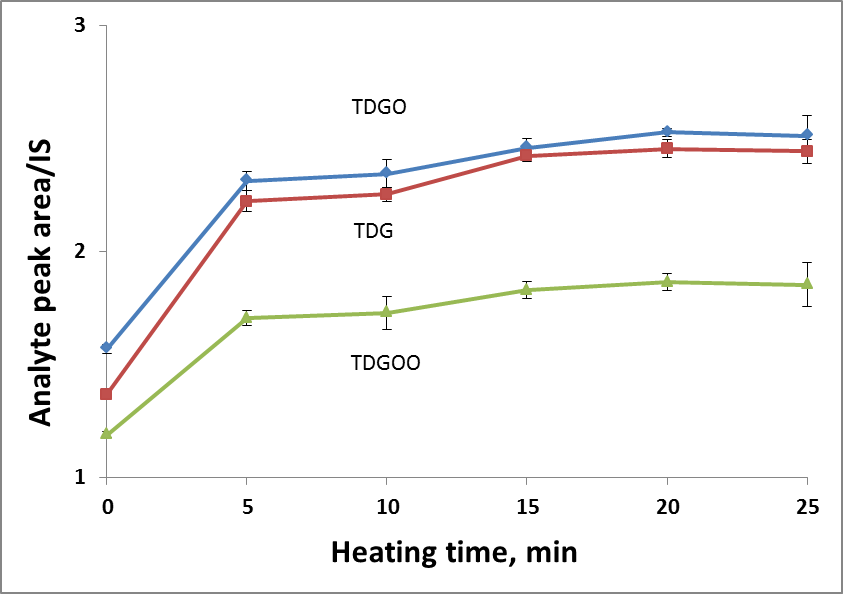
Figure 1. Effect of heating temperature (A) and time (B) on derivatization efficiency


2) Choice of background electrolyte

Underivized TDG and its oxidation products are neutral at pH below 9 and, thus, can be analysed using the MEKC separation technique. Applying 50 mM borate buffer with 100 mM SDS and direct UV detection at 200 nm, TDG and TDGO could be separated within 7 min. The LOD for TDG and TDGO was 0.1 mM. The high values of LOD are logically justified due to the absence of strong UV adsorbing sites. In this work, an improved method for the analysis of target sulphur compounds involved derivatization with phthalic anhydride incorporating chromophore sites into the analyte structure and, at the same time, affecting the pKa value of the formed derivatives and giving a charge to the molecules at pH below 9.


The optimization of the separation conditions was carried out by the investigation of the effect of buffer pH, concentration, capillary temperature and applied voltage on separation efficiency.


It is well known that buffer pH plays the key role in optimization of a separation process affecting the EOF velocity and degree of analyte ionization. So, in the present work a 30 mM borate buffer with a pH range of 7.5 – 10.0 was investigated to evaluate the impact on separation results. At buffer pH values below 8.0, the derivatized analytes were unresolved and the peak shapes were asymmetric.  An increase in the buffer pH value to 8.5 led to improvement in analysis time and all analytes were baseline separated. Further pH change to 9.5 resulted in an increase in the electrophoretic mobility of the analytes. Baseline separation was still achieved and the analysis time was the shortest. Unfortunately, starting at pH 9.0, the sulphone peak area was prone to rapid decrease and at pH 10 almost disappeared, which indicated a strong addiction of thiodiglycol sulphon stability from the pH value of the separation media.


The influence of borate buffer concentration on separation was studied in the range of 20-50 mM at pH 8.5. It was expected that by increasing the buffer concentration the migration time of each derivate would also increase (almost double). Nevertheless, the best separation efficiency was achieved at 30 mM and further concentration increase led to peak broadening without a remarkable change in peak separation.


Additionally, the effect of the applied voltage over the range 15-25 kV and capillary temperature (15-30 C) was also investigated in terms of separation efficiency and migration times. Voltage values above 20 kV resulted in faster migration times of analytes, but the separation efficiency was not sufficient.  All derivatives were baseline resolved at 15 kV, but the analysis time was extended by several minutes. The increase in capillary temperature also noticeably improved the migration time of the derivatives. Thus, the temperature increase from 15 to 30oC decreased the analysis time by a quarter, keeping the separation efficiency at a reasonable level.

Finally, the optimized separation conditions for the separation of three derivatives were as follows: borate buffer concentration 30 mM, buffer pH 8.5, applied voltage 15 kV and capillary temperature 25 °C. The representative electropherogram is shown in Fig. 2.

3


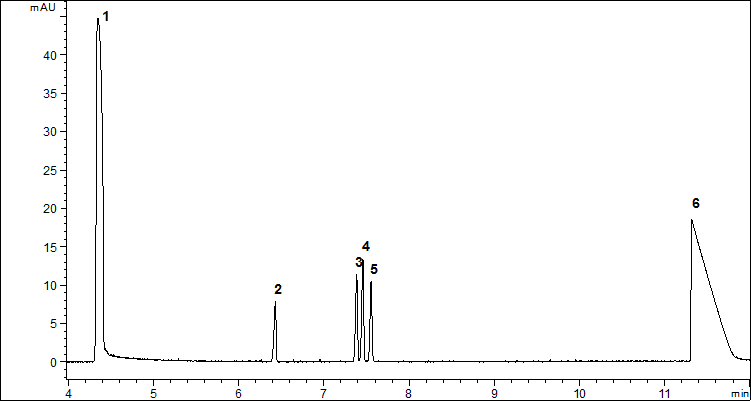
Figure 2. Representative electropherogram obtained after derivatization of 3.05 µg/mL of TDG (4), 3.45 µg/mL of TDGO (3) and 3.85 µg/mL of TDGOO (5) under optimized separation conditions: borate buffer concentration 30mM, buffer pH 8.5, applied voltage 15 kV and capillary temperature 25°C. Additional peaks: EOF (1), IS (2) and phthalic acid (6)


3) CE method validation


The precision of the developed method was investigated.  All precision tests were based on optimized background electrolytes and a standard mixture of derivatives. The tests were performed for the run-to-run and day-to-day variations of the migration times and peak areas. Run-to-run precision resulted in relative standard deviation (RSD) values of 0.6% (n=6) and 2.4-3.1% (n=6) for the migration time and peak area, respectively. Additionally, day-to-day results showed RSD values of 1.2% (n=6) for the migration times and 3.6% (n=6) for the peak areas. There were no systematic changes in peak shape during the precision tests.

The linearity was evaluated in the range of 0.10 – 2.44 µg/mL for TDG, 0.14-2.76 µg/mL for TDGO and 0.15-3.08 µg/mL for TDGOO. Calibration curves were constructed using 5 concentration levels and were based on the ratio of the corresponding derivative to IS peak area versus concentration. The linearity range, regression equations and regression coefficients are shown in Table 1.


Table 1. Regression data for the calibration curves

Derivative

Linearity

range

µg/mL

Regression

equation

Regression coefficient,

R2

Limit of detection,

ng/mL

Limit of quantification,

ng/mL

TDG

0.10-2.44

y=0.1517x + 0.0017

0.9996

98

305

TDGO

0.14-2.76

y=0.1359x – 0.0161

0.9997

138

415

TDGOO

0.15-3.08

y=0.1233x – 0.0304

0.9994

154

463


The limit of detection (LOD) and quantification (LOQ) were obtained experimentally by measuring the signal-to-noise ratio (S/N). The lowest LOD and LOQ were obtained for TDG and calculated as 98 ng/mL (S/N=3) and 305 ng/mL (S/N= 10), respectively.


4) Preliminary studies of sediments


The sediment samples were collected from the bottom of the Baltic Sea at the port of Virtsu (Läänemaa, Estonia; Shceme 1) by the Marine System Institute at TUT. The collected sediment samples were divided into aliquots and stored in a freezer.

4


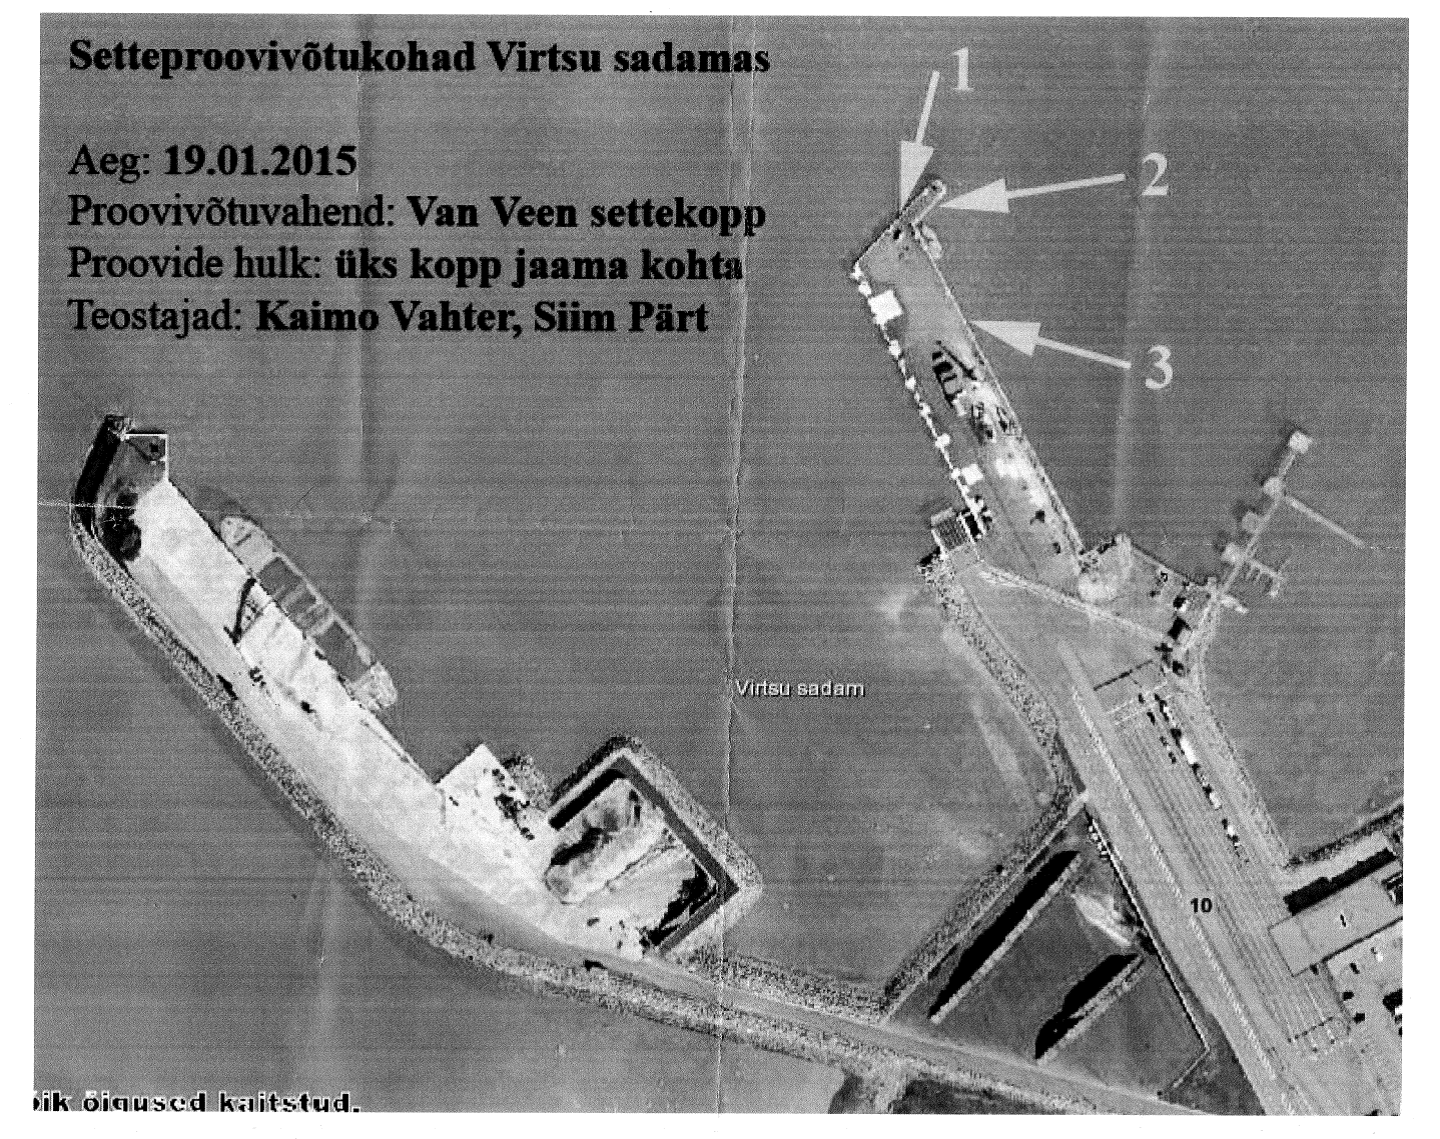
We assume that these samples do not contain the degradation products of sulphur mustard.

The sediment samples were spiked with TDG, TDGO and TDGOO water solutions (final concentration 100, 200 and 400 µM of each). Then the samples were homogenized and shaken for 4 h, after that the samples were placed into refrigerator for 20 h and 7 days.

At the beginning of sample preparation, the sample was taken out from the refrigerator, and left to stand at the room temperature for 1 h. Afterwards the sample was centrifuged for 30 min at 6000 rpm, excess pore water was collected and the remaining sediment was weighed. Then the acetonitrile was added to the sediment sample and the sample was shaken for 20 min at room temperature.  Next the sample was centrifuged for 30 min at 6000 rpm and acetonitrile was collected.

The collected pore water was concentrated by using powdered carbon aerogel to analyse the content of TDG, TDGO and TDGOO [2]. Acetonitrile was used for the elution of compounds of interest from carbon aerogel. Both acetonitrile fractions (from pore water and sediment) were evaporated to dryness and allowed to the derivatization and analysis procedure as described above. Results for TDG and TDGO (total incubation time 24 h) are represented in Table 2.


Table 2.  Contents of TDG and TDGO in spiked sediment.

TDG initial, µM TDG find in pore water, µM TDG find in sediment, µM

0

0

0

100

10

10

200

23

45

400

81

138

TDGO initial, µM TDGO find in pore water, µM TDGO find in sediment, µM

0

0

0

100

10

18

200

76

30

400

129

75


It can be seen from the Figure 3 that the adsorption of TDG and TDGO to the sediment is rather similar.

5

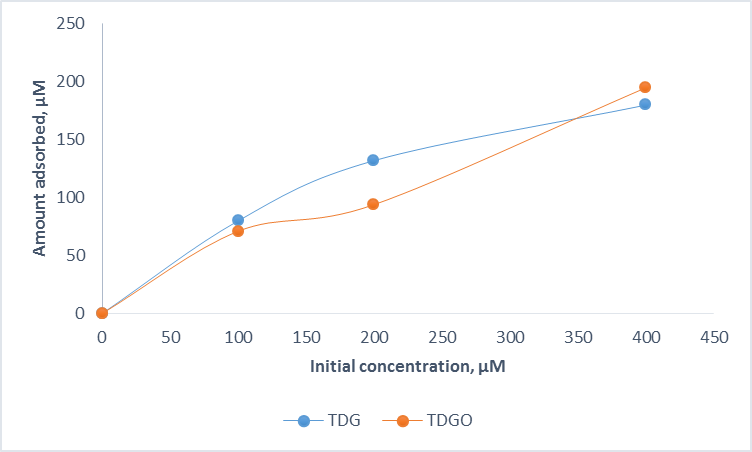
Figure 3.  Adsorption data in sediment.

Based on the results of preliminary tests it can be concluded that after the incubation in the refrigerator for 7 days the TDG is completely lost, the concentrations of TDGO and TDGOO are decreased 8 and 3 times, respectively.

The investigations will be continued.

  1. Vanhoenacker, G., De Keukeleire, D., Sandra, P.  J. Sep. Sci. 2001, 24, 651-657.
    1. P. Jõul, H. Lees, M. Vaher, E.-G. Kobrin, M. Kaljurand, M. Kuhtinskaja. Electrophoresis, 2015, DOI: 10.1002/elps.201500038.


Hamburg Meeting

MODUM

4th Meeting

Title 4thMODUM working Meeting
Location Hamburg
Date 27-29 May 2015
27-May MODUM
Start End Time Item Contact
12:00 13:00 1:00 Lunch
13:00 13:30 0:30 Project Status Jacek Bełdowski
13:30 14:00 0:30 Financial Issues Jacek Bełdowski
14:00 15:30 1:30 Reports of Partners (15 minutes each) All partners
15:30 16:00 0:30 Cofee break All partners
16:00 17:30 1:30 Reports of Partners (15 minutes each) All partners
17:30 Free time in Hamburg All partners
Sum 5:30
28-May MODUM
Start End Time Item Contact
8:30 9:30 1:00 Summary of reports Jacek Bełdowski
9:30 10:30 1:00 Parallel Sessions
10:30 11:00 0:30 Cofee Break
11:00 12:00 1:00 Parallel Sessions
12:00 13:00 1:00 Lunch
13:00 14:30 1:30 Parallel Sessions
14:30 15:00 0:30 Cofee Break
15:00 17:00 3:00 Reports of WP Leaders All partners
18:00 20:00 2:00
20:30 Dinner
Sum 11:30
29-May MODUM
Start End Time Item Contact
8:30 9:30 1:00 Steering Comitee Meeting Jacek Bełdowski
9:30 10:00 0:30 Cofee break All partners
10:00 12:00 2:00 Discussion & Planning
12:00 13:00 1:00 Lunch All partners

WP 4. Monitoring

This work package will be focused on the preparation of a suitable and operational monitoring strategy. It will also include sample and environmental parameters collection from the dumpsites, sample analysis as well as data management and assimilation into the models developed. Equipment tests and selection will be performed within WP3 Survey

Task 4.1 Moored Station

A moored station collecting oceanographic data affecting local mixing and sediment erosion processes will be deployed in the most hydrodynamically important area for the dumpsites region already during the test stage, built from existing equipment of IOPAS and IORAS. This will provide data for selection of best sensors and locations for the moored station in the later stage.

Data collection will start already in month 9, supplementing the data collected within the test period.

Once monitoring areas are established by WP3 Survey, possible repositioning of the moored station to collect oceanographic data influencing monitored sites will be performed. Throughout the project, several cruises are planned which will include data readout, maintenance and deployments of mooring in various areas.

Task 4.2 Environmental data collection

Once the key areas have been identified and surveyed by AUV, ROV and ship-based missions will commence. Missions will be performed from the research vessels participating in the project and from smaller boats, the latter either supplied by IORAS in the frame of national contribution, or hired from the project budget. Small craft handling training will be performed for IOPAS scientists, to enhance their possibilities for operation on hired boats.

During the cruises, oceanographic and chemistry data will be collected, by means of ship based/towed sensors, and AUV based sensors. Key environmental variables will be measured, including oxygen concentration, bottom current speed and direction, turbulence, temperature and salinity. ROVs equipped with video solutions will be used to create pictures of sea bottom for habitat damage evaluation.

Task.4.3 Sampling

Sampling missions include the use of ROV for sampling sediments in the vicinity of chemical munitions. Collected samples will be stored, and if additional funds will become available, will be a subject of detailed chemical contaminant analysis.

For selected samples, laboratory analyses of Arsenic speciation will be performed. Milestones of this stage will include: a study on portable methods suitability for CWA monitoring, pollution distribution near selected objects, and an input into Environmental Risk Assessment calculation.

Starting from the first year, two fish sampling campaigns will be conducted, if possible, connected to AUV data on objects location. Fish health studies will be performed, to assess CWA effect on biota. The data obtained will then be used for WP5 Environmental Risk Assessment.

Task 4.4 Data center

Simultaneously, a data center will be constructed, and procedures established for data collection and sharing between different work packages.

Deliverables of this part are the procedures for data assimilation and the database for collection of monitoring data.

Once the data center is operational, it will receive data from both moored and mobile parts of the monitoring network, providing it for assimilation in WP5.

This WP constitutes 30% of overall project success.

WP3 Survey

This work package will be focused on identifying and defining the areas for future monitoring. It will include the selection of best equipment, based on the scientific expertise and field tests.

Task. 3.1 Equipment and post-processing methods

WP3 starts with the selection of optimal sensors and equipment. This will include Autonomous Underwater Vehicles (AUV) with payload including acoustic sensors and magnetometer, as well as Eco-mapping capabilities and Remotely Operated Vehicles (ROV) equipped with video and acoustic cameras, for objects detection and identification, and multi sample collection system This task will also select the best equipment for the WP4 Monitoring. Based on experience of co-directors, best equipment will be selected and rented for the test purposes.

Test cruises will be performed in month 6. A test cruise will be performed in cooperation with NATO CMRE Center in the Mediterranean Sea in month 6. An additional test cruise, if needed, will be performed in the Baltic Sea in Month 9. If additional tests are needed, they will be extended in month 9.

Data collected within test cruises will be postprocessed to obtain high quality results, and data will be verified by cross comparison of multiple instruments and position data of targets. Methods developed at this stage will be the base for data handling within the project.

A deliverable of the test cruises will be a suitability report of tested equipment for WPs 3 and 4.

After the report is completed, market research will follow for the final selection of criteria for selected equipment. The deliverable of this stage will be the specification of terms of reference to be used in public bidding (open tender) procedure for purchasing the equipment.

When the equipment is purchased, ships taking part in the project (IOPAS, FI, IORAS and LEPA) will be adjusted to handle AUVs and ROVs operating in the project. This will include modifications of existing infrastructure to suite deployments, retrievals and data collection from devices used in the project.

Task 3.2 Area Selection

Basing on the results of past research projects, geographical areas will be selected for survey and monitoring. For this purpose, maps representing known object location and density of survey data will be constructed. This will include several potential areas: primary and secondary dumpsite areas in Bornholm Deep, parts of Gotland Deep dumpsite and Gdańsk Deep. Based on probability of ammunition detection, ecological importance and needed survey time, three areas will be selected for surveying and monitoring activities.

Deliverable of this task will include maps of high and medium priority areas to be covered by survey and monitoring.

Task 3.3 Surveying areas for monitoring

After the completion of previous activities, missions will be commenced with the use of AUVs and ROVs.

Missions will be performed from the ships participating in the project, using as little ship time as possible – possibly in parallel with other research activities. Also, suitability of small boats will be assessed to perform AUV missions. Two types of surveys are predicted – Area Wide Assessment (AWA) and a Detailed Survey and Investigation (DSI). At the beginning of the project, AWA missions will be commenced in previously (3.2) defined areas, starting with high priority and extending to medium priority if time permits. During AWA missions, AUV will be deployed with acoustic and magnetometric gear in a densely spaced grid to detect the objects resting on the sea bottom. Data will be received and post-processed by project geophysicists and provided to project data center to evaluate object classes, and probability of the object being sea- dumped chemical munitions. Most promising (class 1) objects will be included in DSI. DSI will use AWA data to visit class 1 objects by ROV and provide visual or high resolution acoustic data from different angles to prepare the list of chemical munitions objects to be used in WP4 Monitoring. Further reduction of false-positive targets, especially from buried objects, will be possible by the use of larger ROV, capable of careful uncovering of munitions covered by mud. Due to limited funds, such ROV will be used only in the Bornholm dumpsite, for a 10 day campaign, including transit and downtime in case of bad weather. Project team will investigate additional funding sources to enhance this type of survey also to other areas. Quality management of data will be provided by performing periodic tests and calibration of survey equipment – by means of external experts from NATO CMRE participating in project cruises and by calibrating equipment in controlled harbor conditions.

Milestones for this period will include detailed maps of future monitoring areas and a list of probable CWA objects therein. An idea is to have a representative portion of the dumpsite thoroughly mapped, which will serve as a sound base for monitoring and risk assessment. This work package represents 20% of the project success.

ECORisk

Advances of modeling on model requirements (based on assessment in model requirments, Task 5.6, deliverable 5.6.1., WP5 – Environmental Risk Assesment)


Jaromir Jakacki, Institute of Oceanology PAS

Mariya Golenko, Institute of Oceanology RAS


            As the main tools in the modeling part of this project it is planned to use two models:

1)        Community Earth System Model (CESM) recently developed at National Centre for Atmospheric Research (NCAR) and University Corporation for Atmospheric Research (UCAR). The Baltic Sea version of this model was created and developed at the Institute of Oceanology. The model was implemented for the following configuration:

a)         advection is represented by central difference operator,

b)        biharmonic horizontal mixing,

c)         modified k-profile parameterization for vertical mixing. The modification has been done for vertical viscosity coefficient for turbulence profile similar to Mellor-Yamada which is mostly used for shelf seas like Baltic Sea,

d)        the dependence on the bottom cell thickness was added to the bottom drag for better representation of the bottom friction,

e)         at the model boundary, in the Kattegat sea level from Goteborg was assimilated – gradient of the difference between real and modeled sea level has been added to the barotropic equation,

f)         Orlanski open boundary was also implemented at the model boundary

g)        the model has horizontal resolution about ~2.3 km (1/48 degrees) and 66 vertical levels. Model domain, bathymetry and vertical levels are presented on the figure 1.

h)        The model is forced by ECMWF ERA40 reanalysis and by data from model UM used as the European operational weather forecasting system.

2)        Princeton Ocean Model

POM is a free surface, hydrostatic, sigma coordinate hydrodynamic model with an imbedded second and a half moment turbulence closure sub-model (Mellor, Yamada 1982). The modeling domain comprises of a wide area from the Arcona to the Gotland Basins (fig. 2) with a horizontal resolution of ~ 1.8 km along X and Y directions. The bottom topography is taken from source (Seifert, Kayser 1995). 36 sigma layers are specified. The vertical grid size is logarithmically refined towards the bottom in order to resolve BBL.

On the partly opened lateral boundaries the radiation condition (Blumberg, Mellor 1987, Androsov, Voltzinger 2005) as well as the data of other models comprising the considering area are used. Previously this configuration of POM was adapted for the Central and South-East Baltic and verified with detailed CTD and ADCP field data (Golenko et al. 2009, 2012).

Real atmospheric forcing is prescribed on the surface. Two components of the wind stress, air temperature at 2m height above the sea, air pressure, humidity, precipitation and total cloudiness are interpolated from the HIRLAM grid (10km resolution in both horizontal directions) into the POM grid. All these variables are used to calculate the heat flux onto the surface. The initial temperature (T) and salinity (S) stratifications can be interpolated from other models (for ex. HIROMB: 1nm resolution in horizontal directions and 5m in vertical) as well as set horizontally homogeneous corresponding to mean profiles observed in the considering region in the particular season.

Figure 1. Model domain, bathymetry (color scale is in levels) and vertical resolution plot (inside the picture).


Figure 2. The bottom topography of the Central and South-East Baltic. The presented area is the modeling domain on the base of POM. Red spots denote the points where the lagrangian particles were released from in the BBL. Green spots denote dumpsites of the chemical munitions and supposed to be considered in the project.


As a first step it is planned to have the models at the same state. It means the models will be started from the same initial conditions; the same atmospheric fields will force both of them. Then the results from both models will be compared and it would be focused on the bottom currents. The main goal of this important part of the project is to combine measurements and modeling. Data from moored stations and AUV’s will be compared with both model results and then the models will be tuned up for having the most similar results. The last step is to apply assimilation where it will be possible. The main planned work is presented on the diagram (on the next page).