THEMATIC MAPS
Schematic layout of sea currents in Kongsfjorden

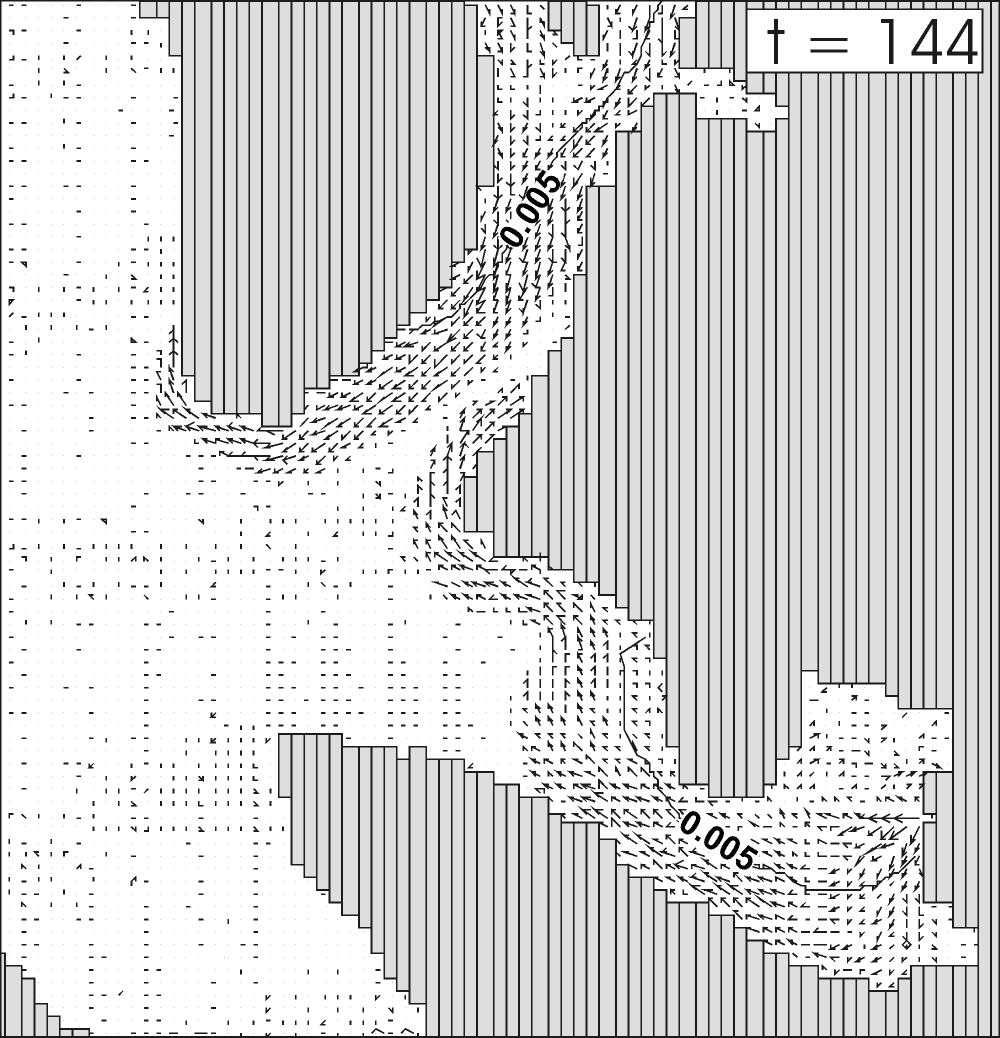
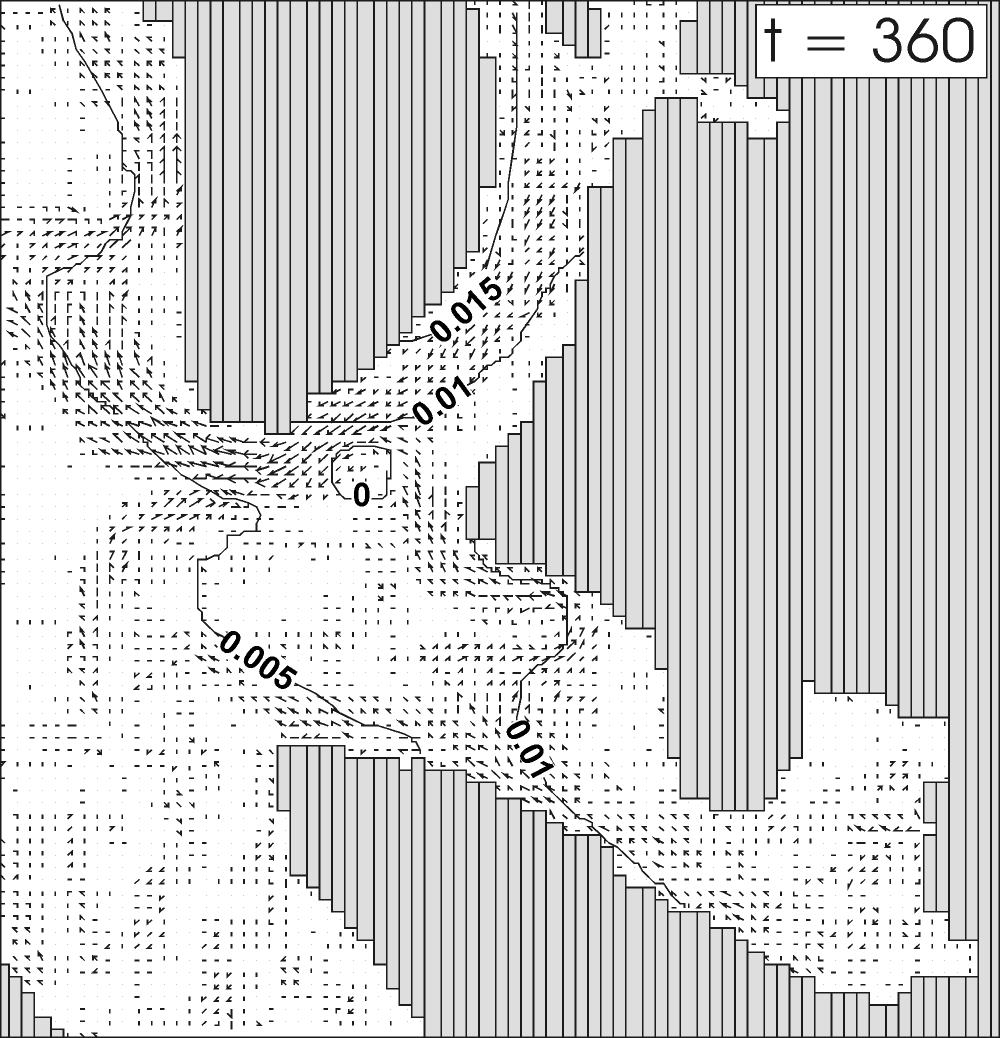
Simulated surface circulation pattern:
(left) freshwater-driven with runoff from three sources, 55 m3 s-1 from the head of Kongsfjorden and 15 m3 s-1 from the head of each of the two fiord arms in Krossfjorden. Simulations time is 144 hours;
(right) freshwater and down-fiord wind-driven with the same runoff and with wind speed of 6.5 m s-1. Simulations time is 360 hours. The wind forcing is in the period of 192-240 hours. The lines indicate surface height.
Svendsen et al. 2002, Polar Research, 21(1), 133-166.