14.5. Hornsund 2013-2015 - Species Distribution Modelling project by Anna Drewnik
From the worm's point of view
I. Environmental settings of benthic ecosystems in Arctic fjord (Hornsund, Spitsbergen)
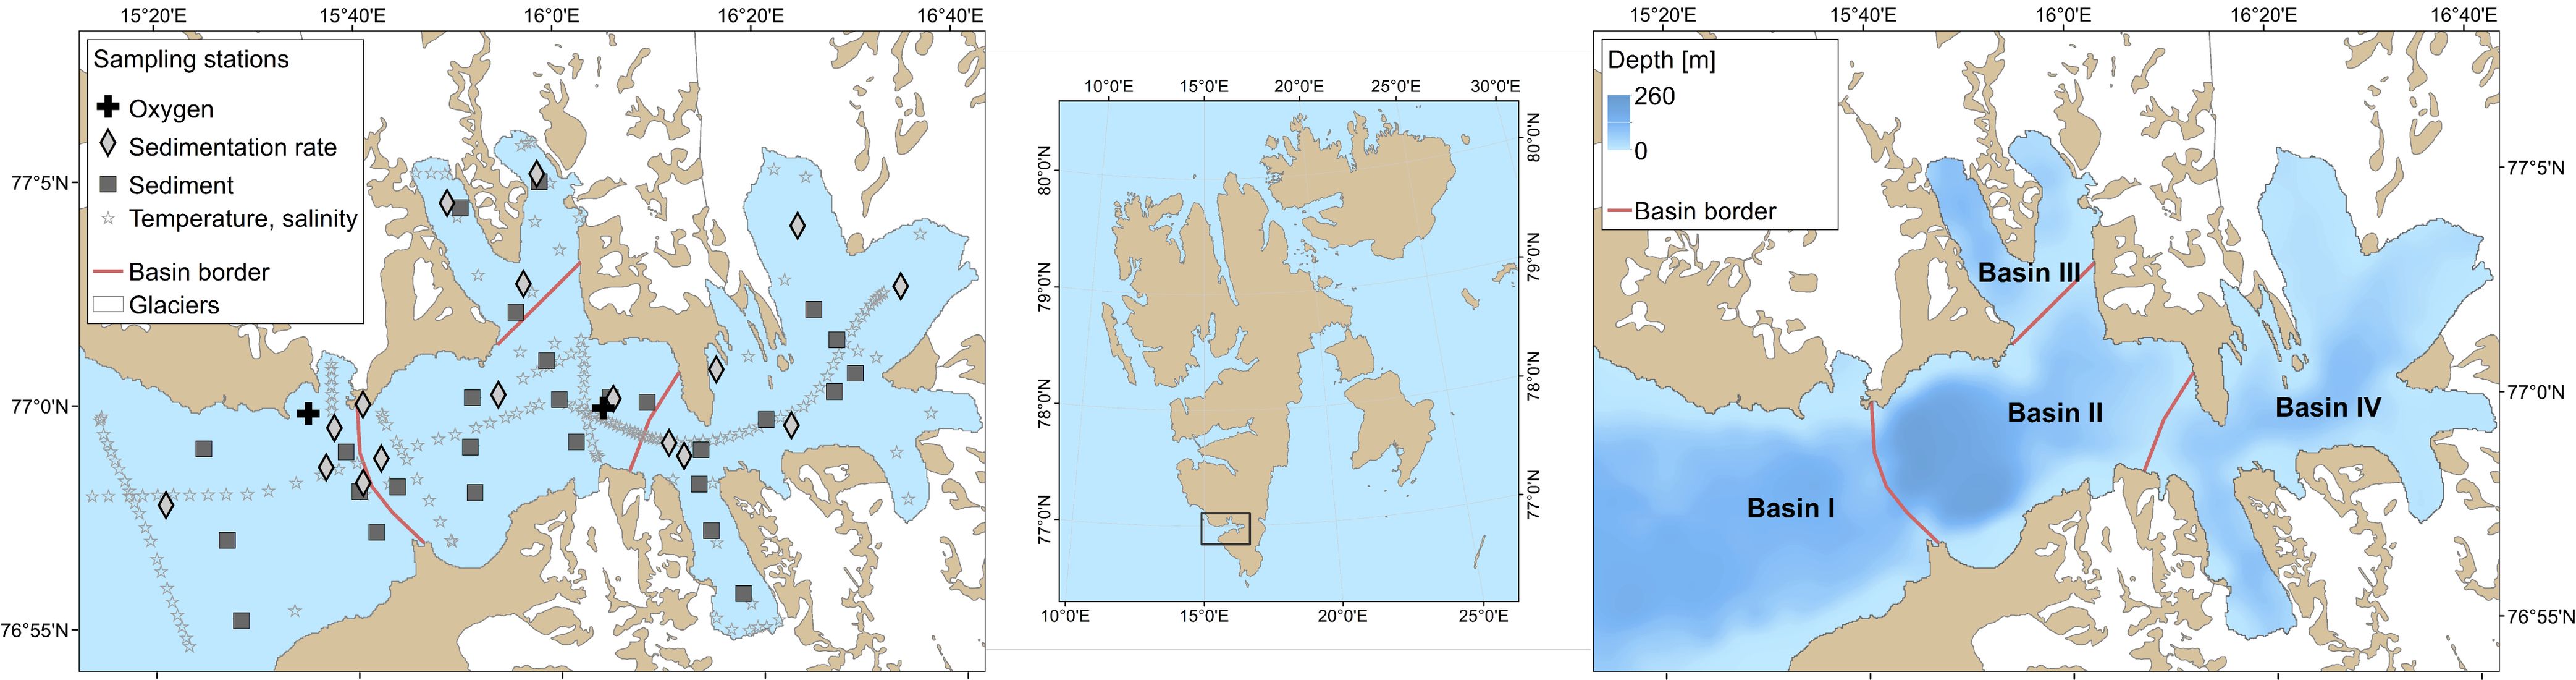 Fig. 1 Study area-Hornsund fjord (Svalbard Archipelago, Arctic). Location of sampling stations and individual fjord basins (borders set at topographic shallows of the seafloor). |
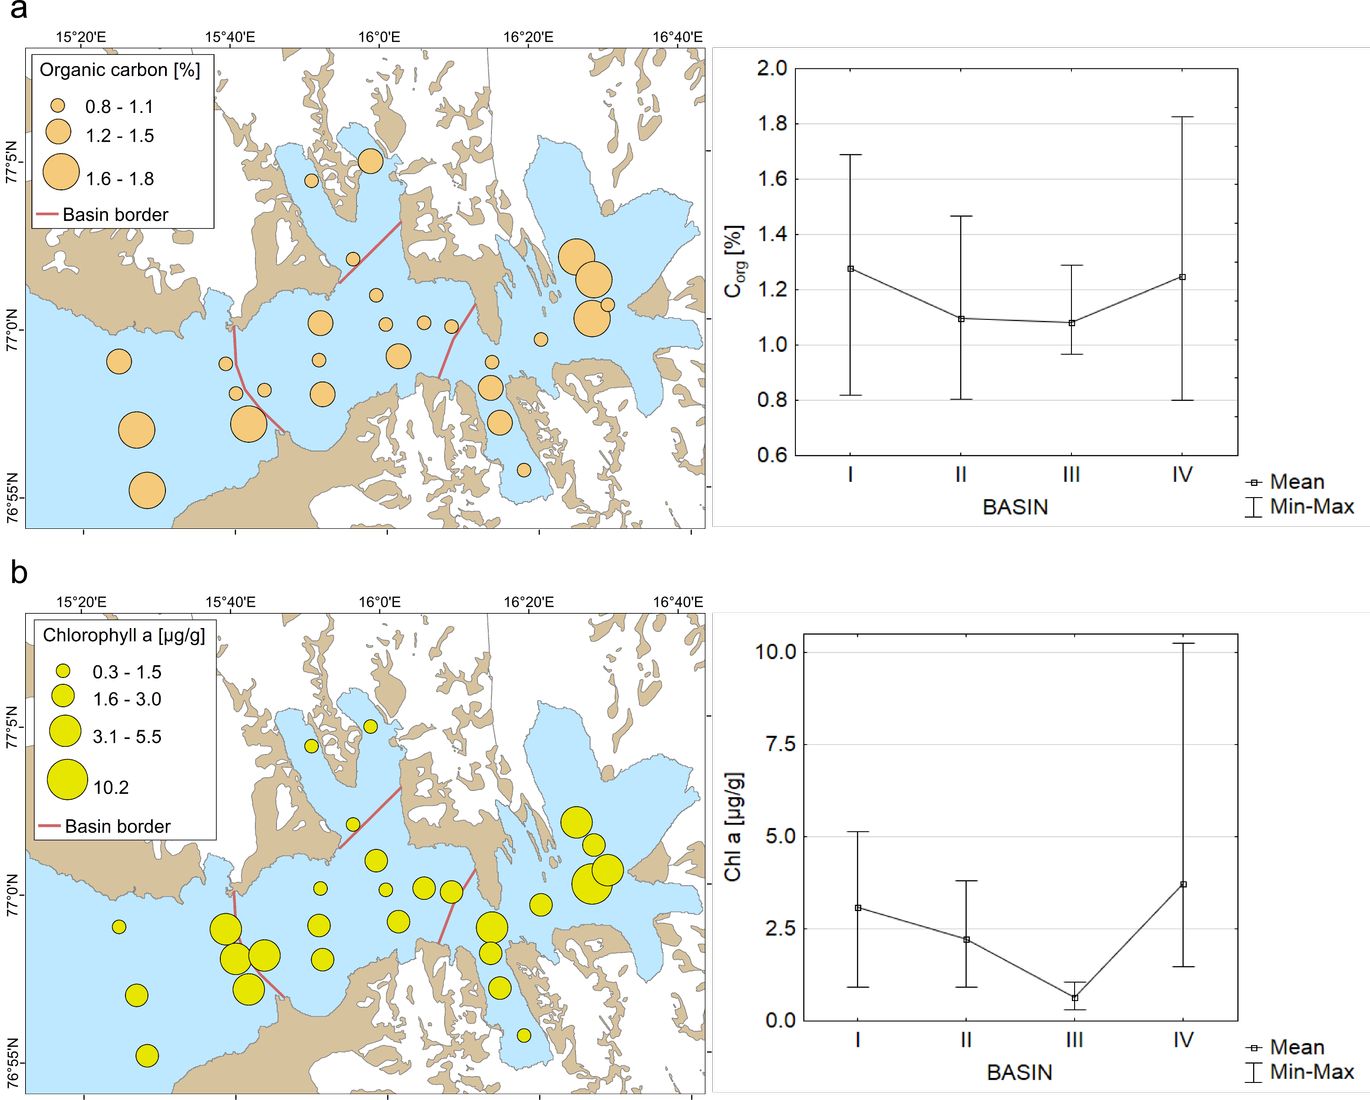 Fig. 2 Organic carbon content (a) and chlorophyll a concentration (b) in Hornsund fjord sediments. Data collected in 2012. |
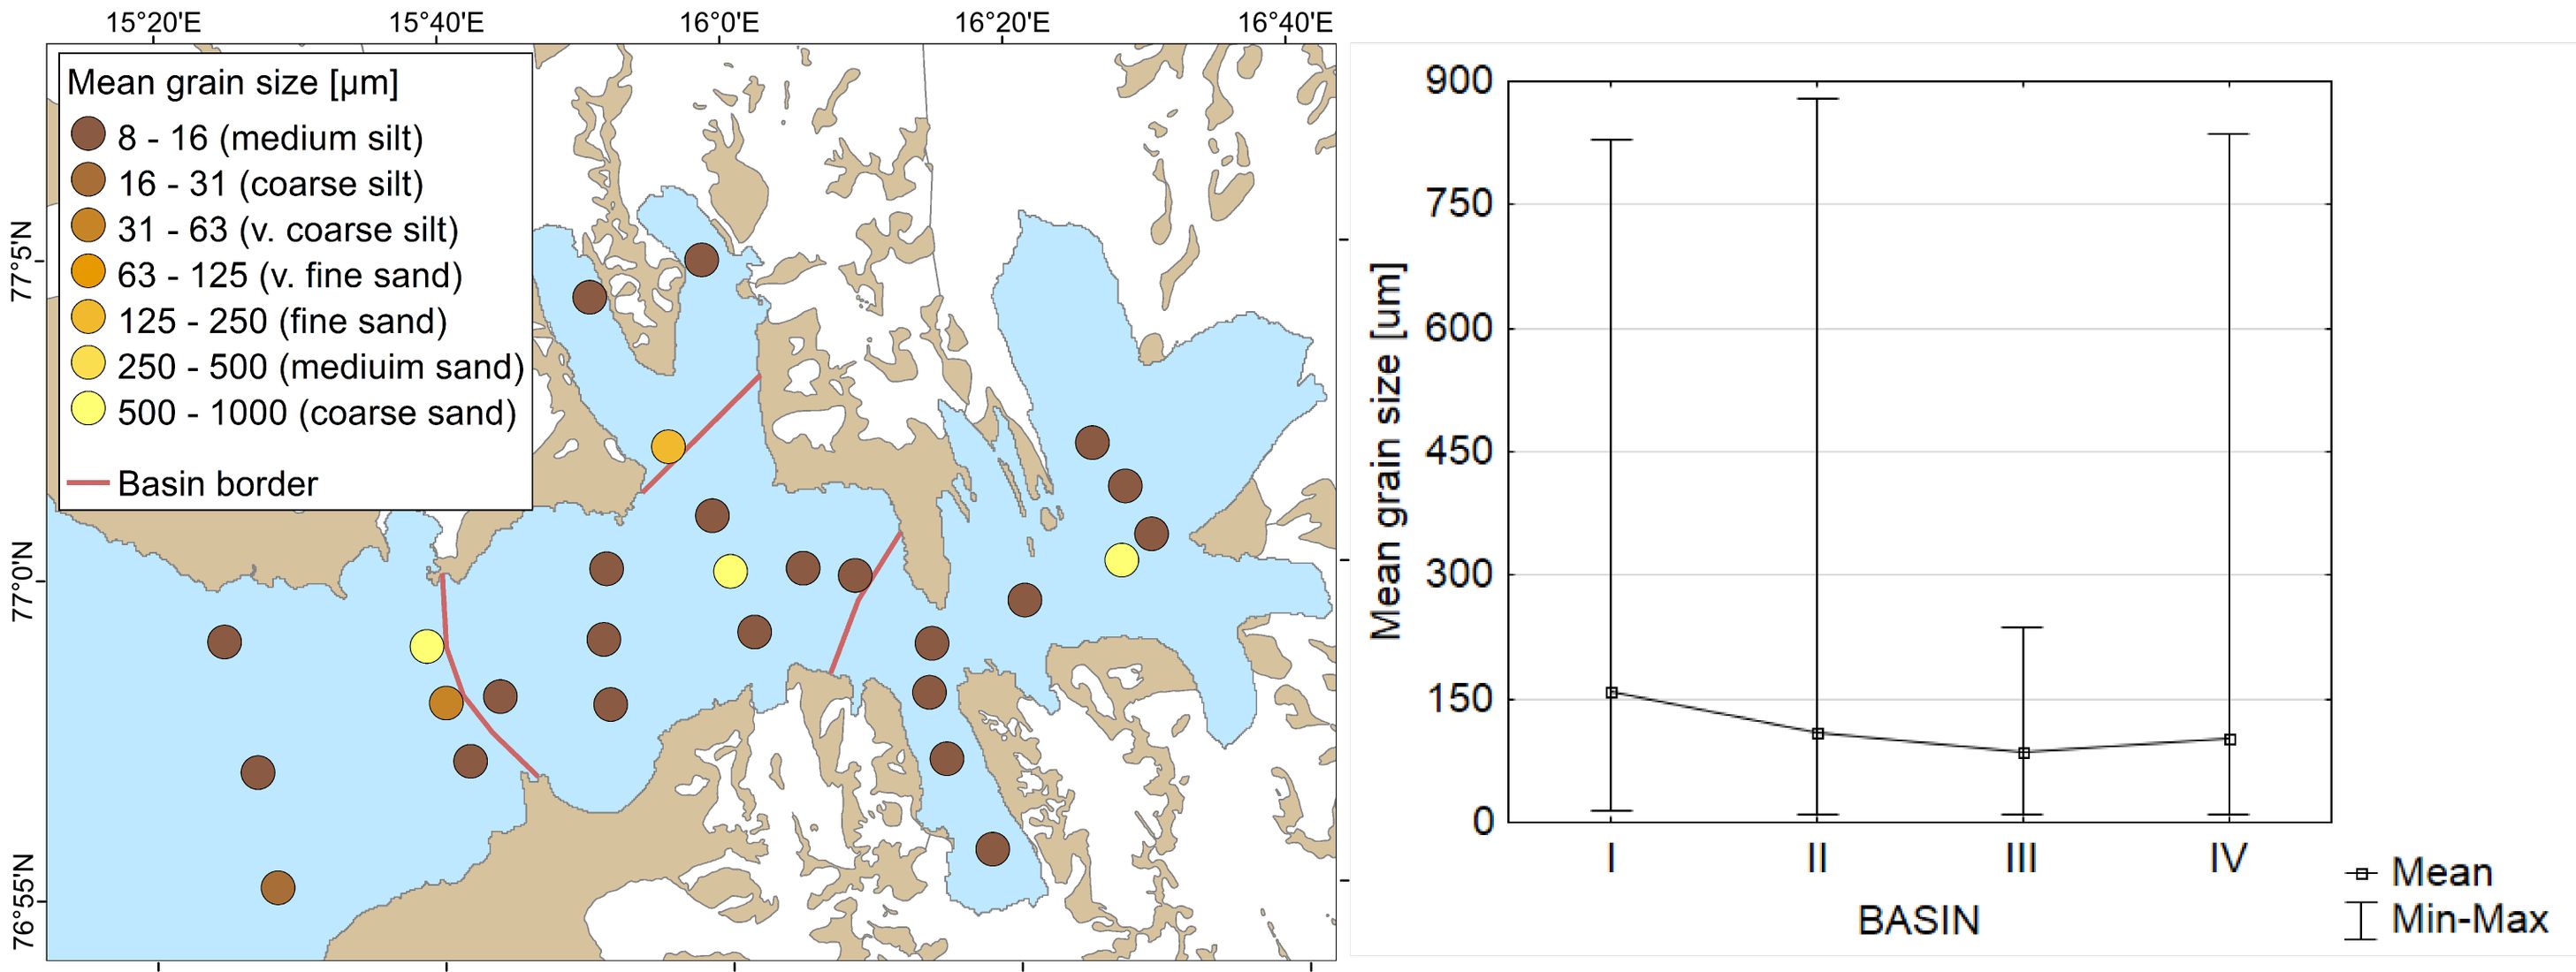 Fig. 3 Distribution of sediment types in Hornsund fjord (categorized based on the Wentworth (1922) scale). |
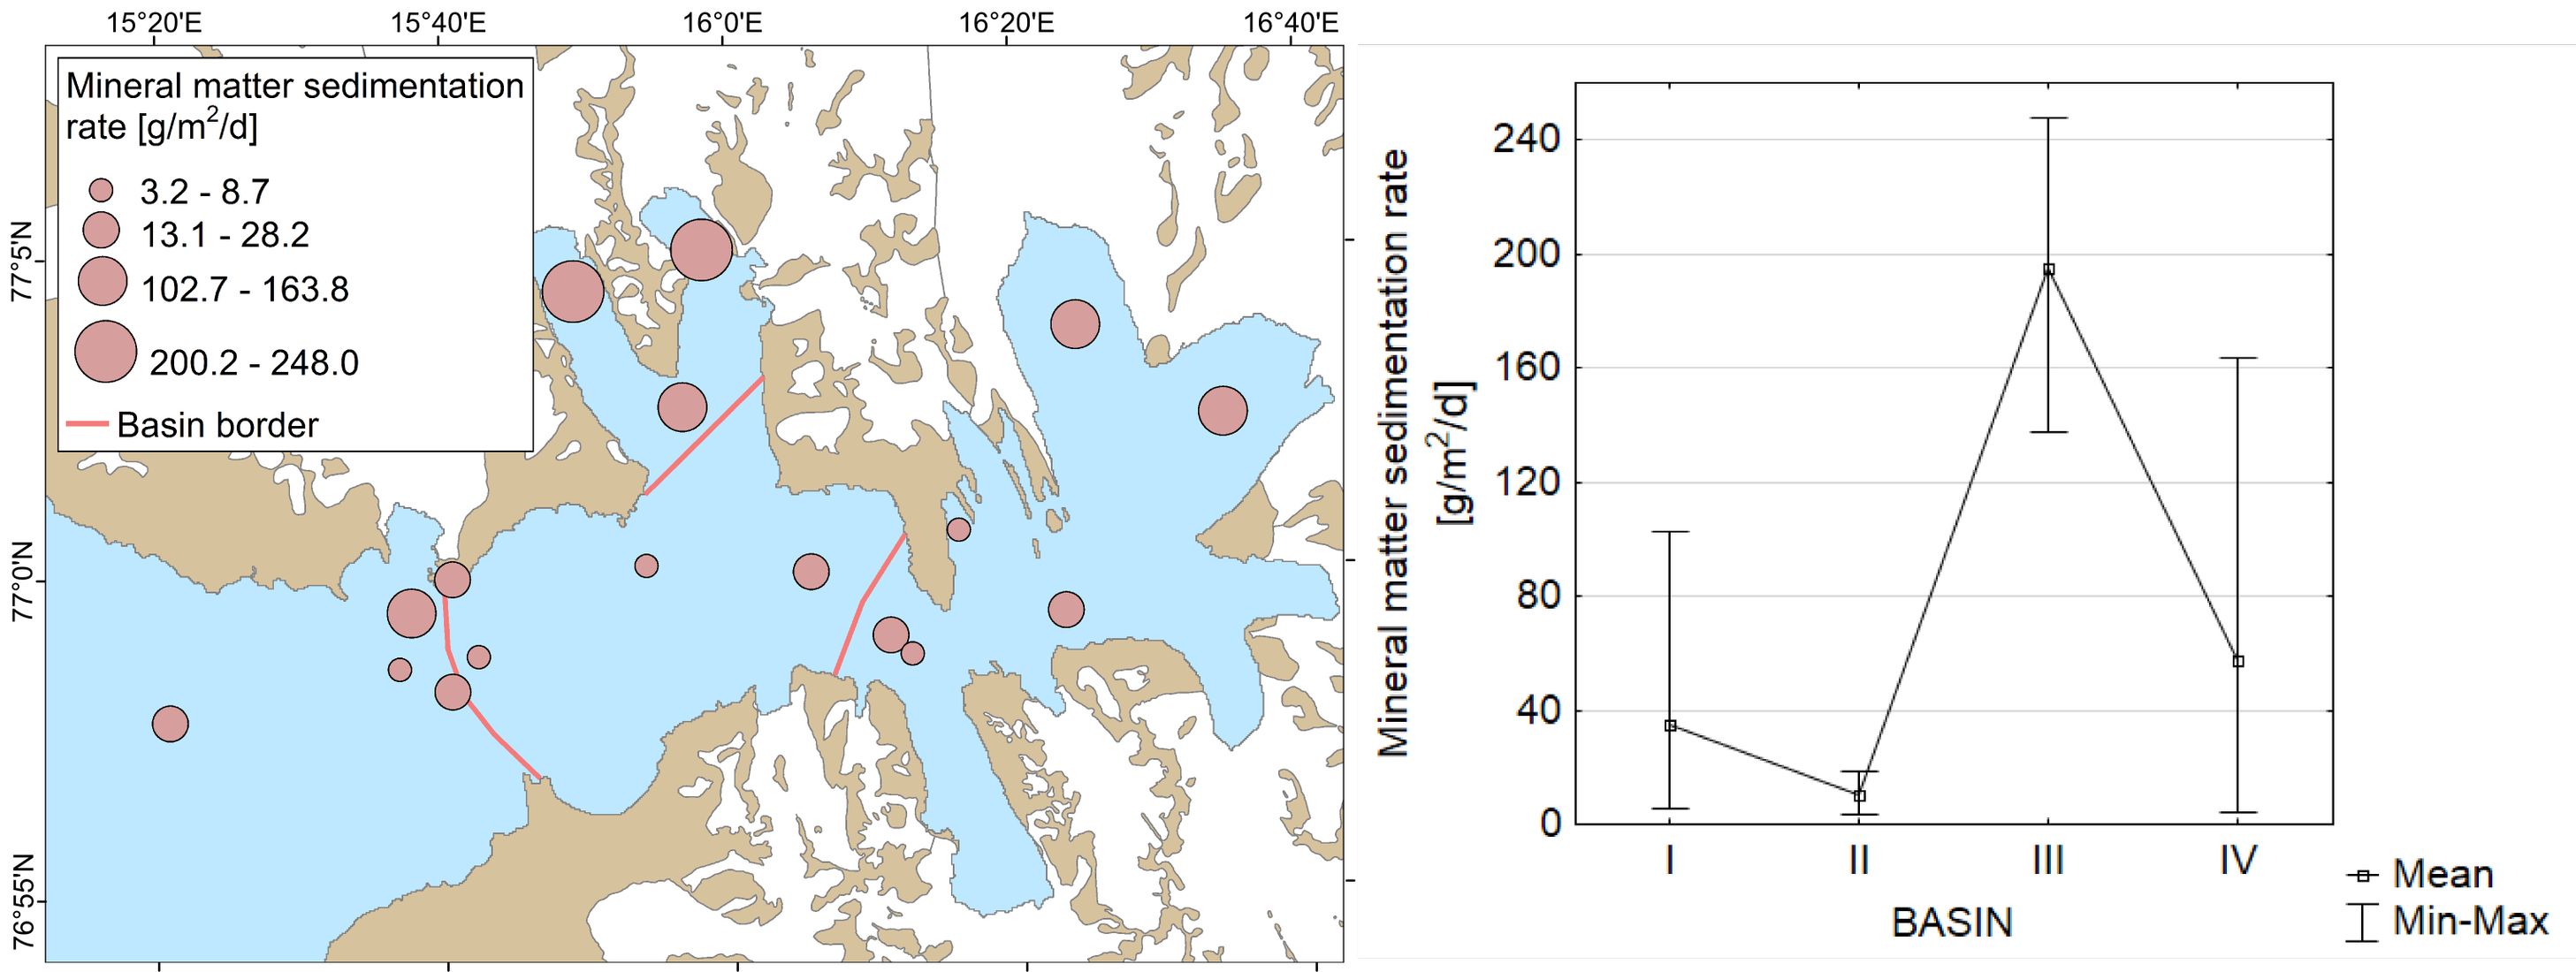 Fig. 4 Data on mineral matter sedimentation rates collected in Hornsund fjord in 2012-2013. |
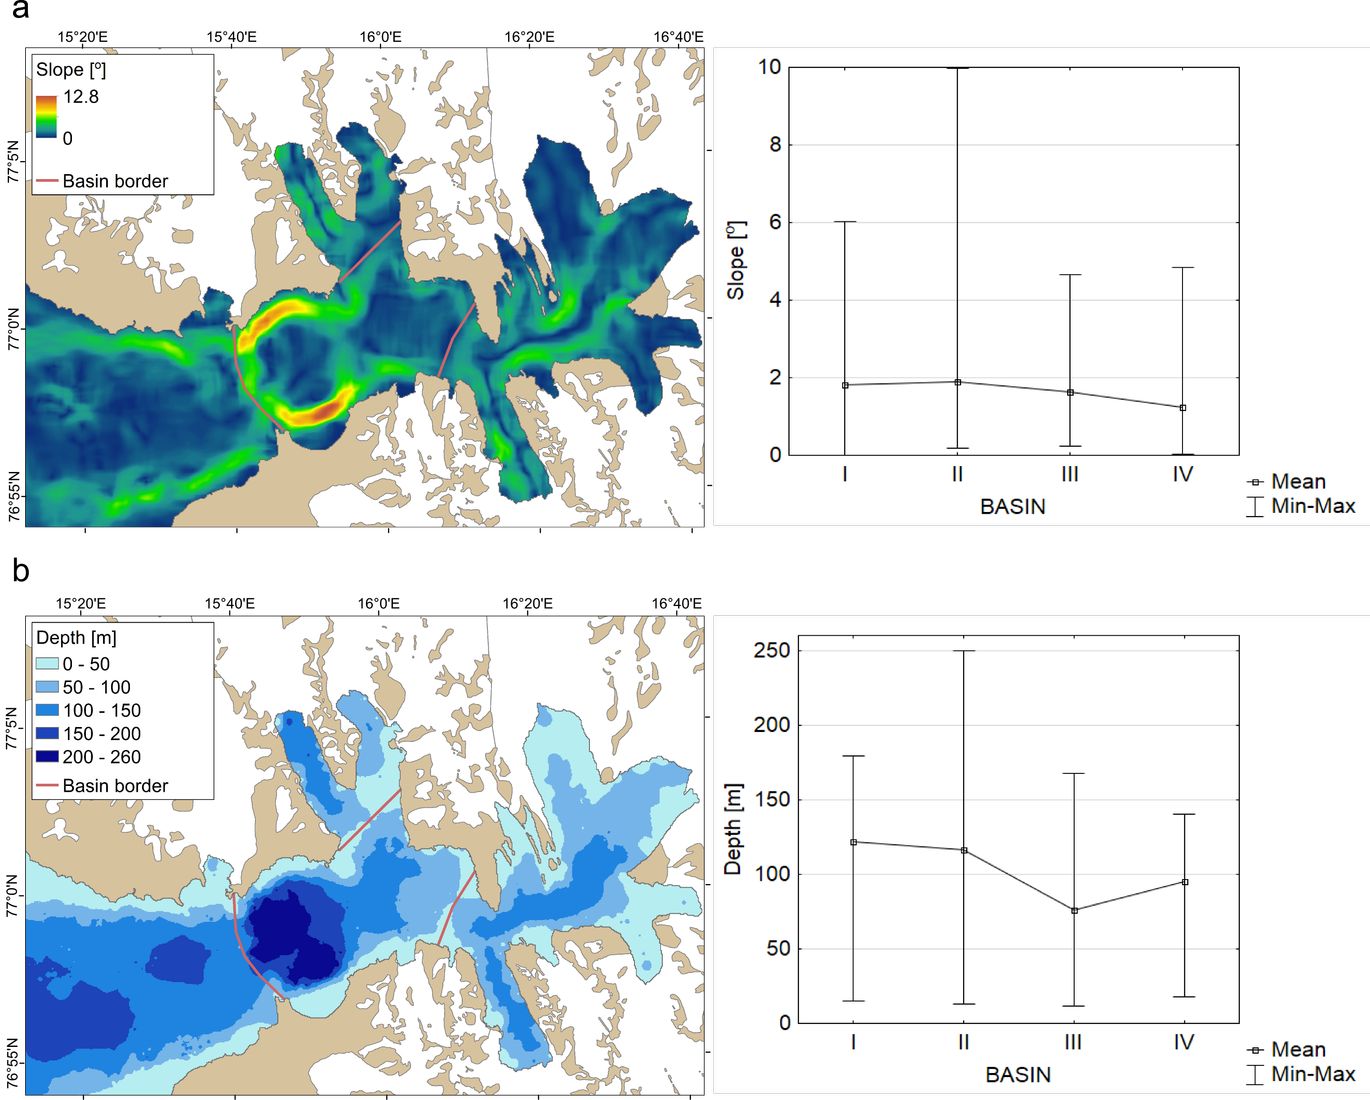 Fig. 5 Seabed slope (a) and depth (b) of Hornsund fjord. |
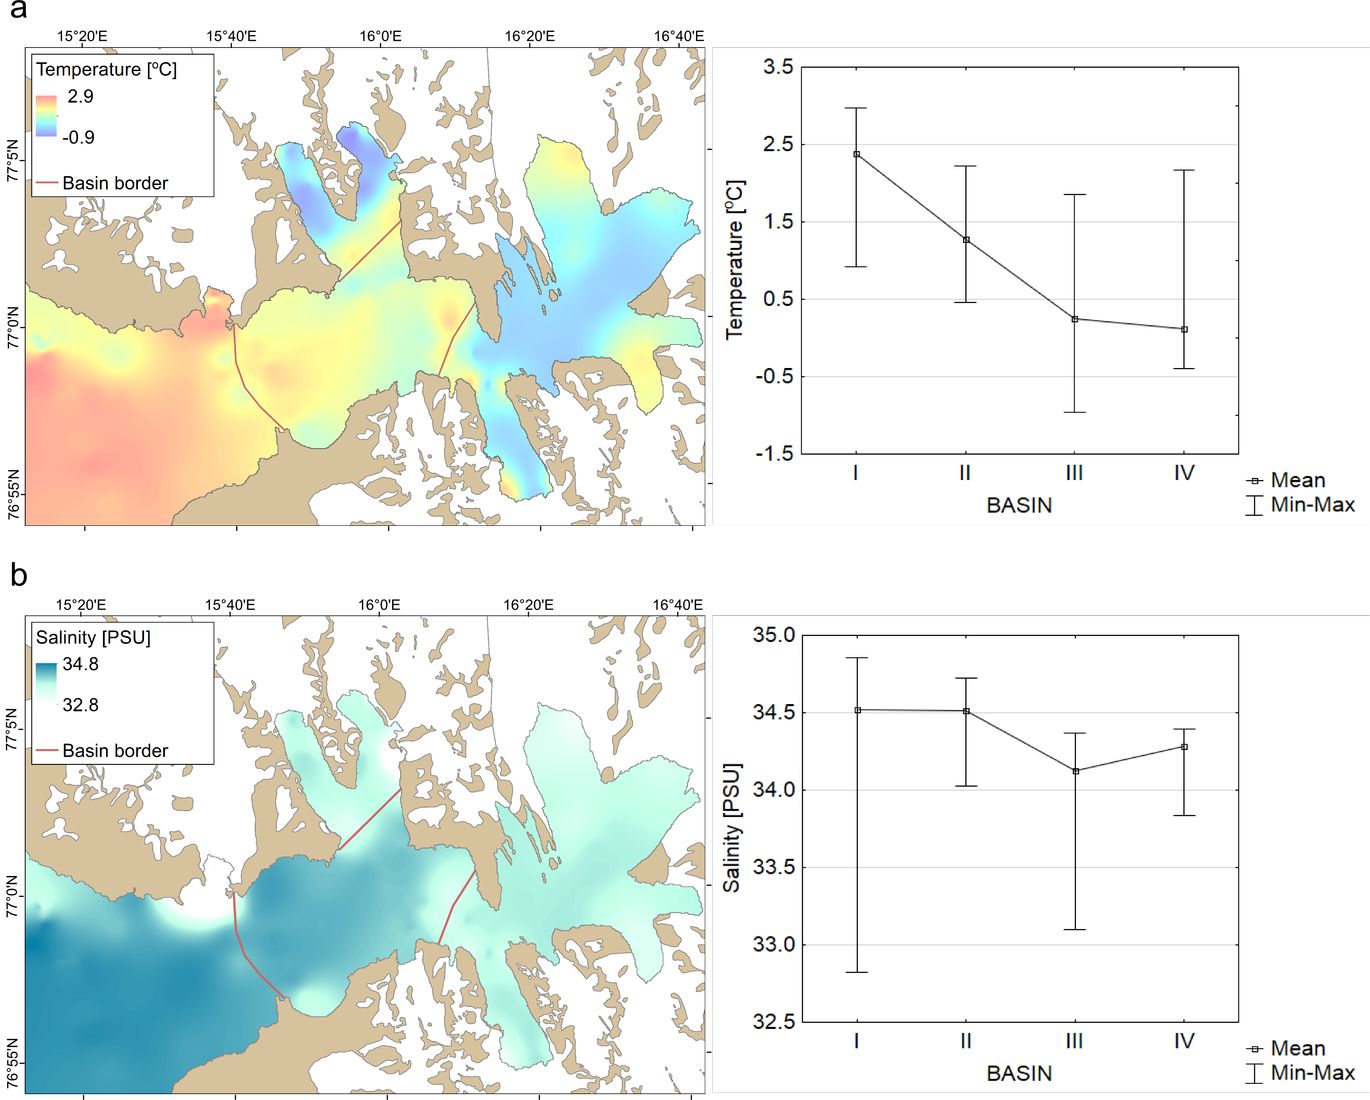 Fig. 6 Near-bottom temperature (a) and salinity (b) of Hornsund fjord waters in 2012. |
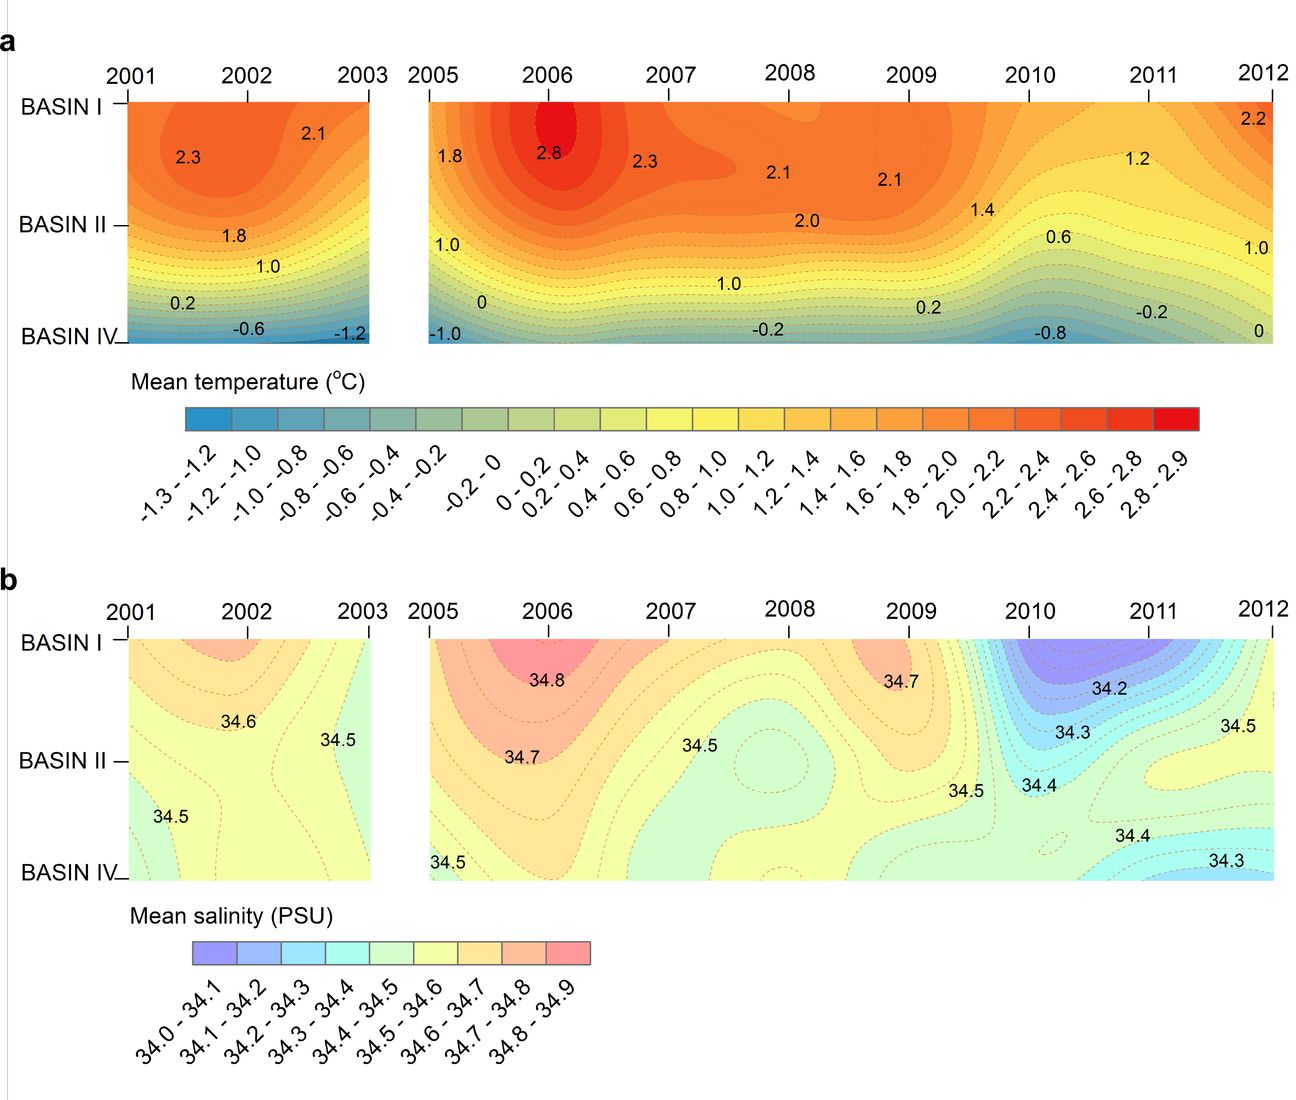 Fig. 7 Long-term variability of near-bottom water temperature (a) and salinity (b) among Hornsund fjord basins. Data collected along fjord axis in 2001-2012. |
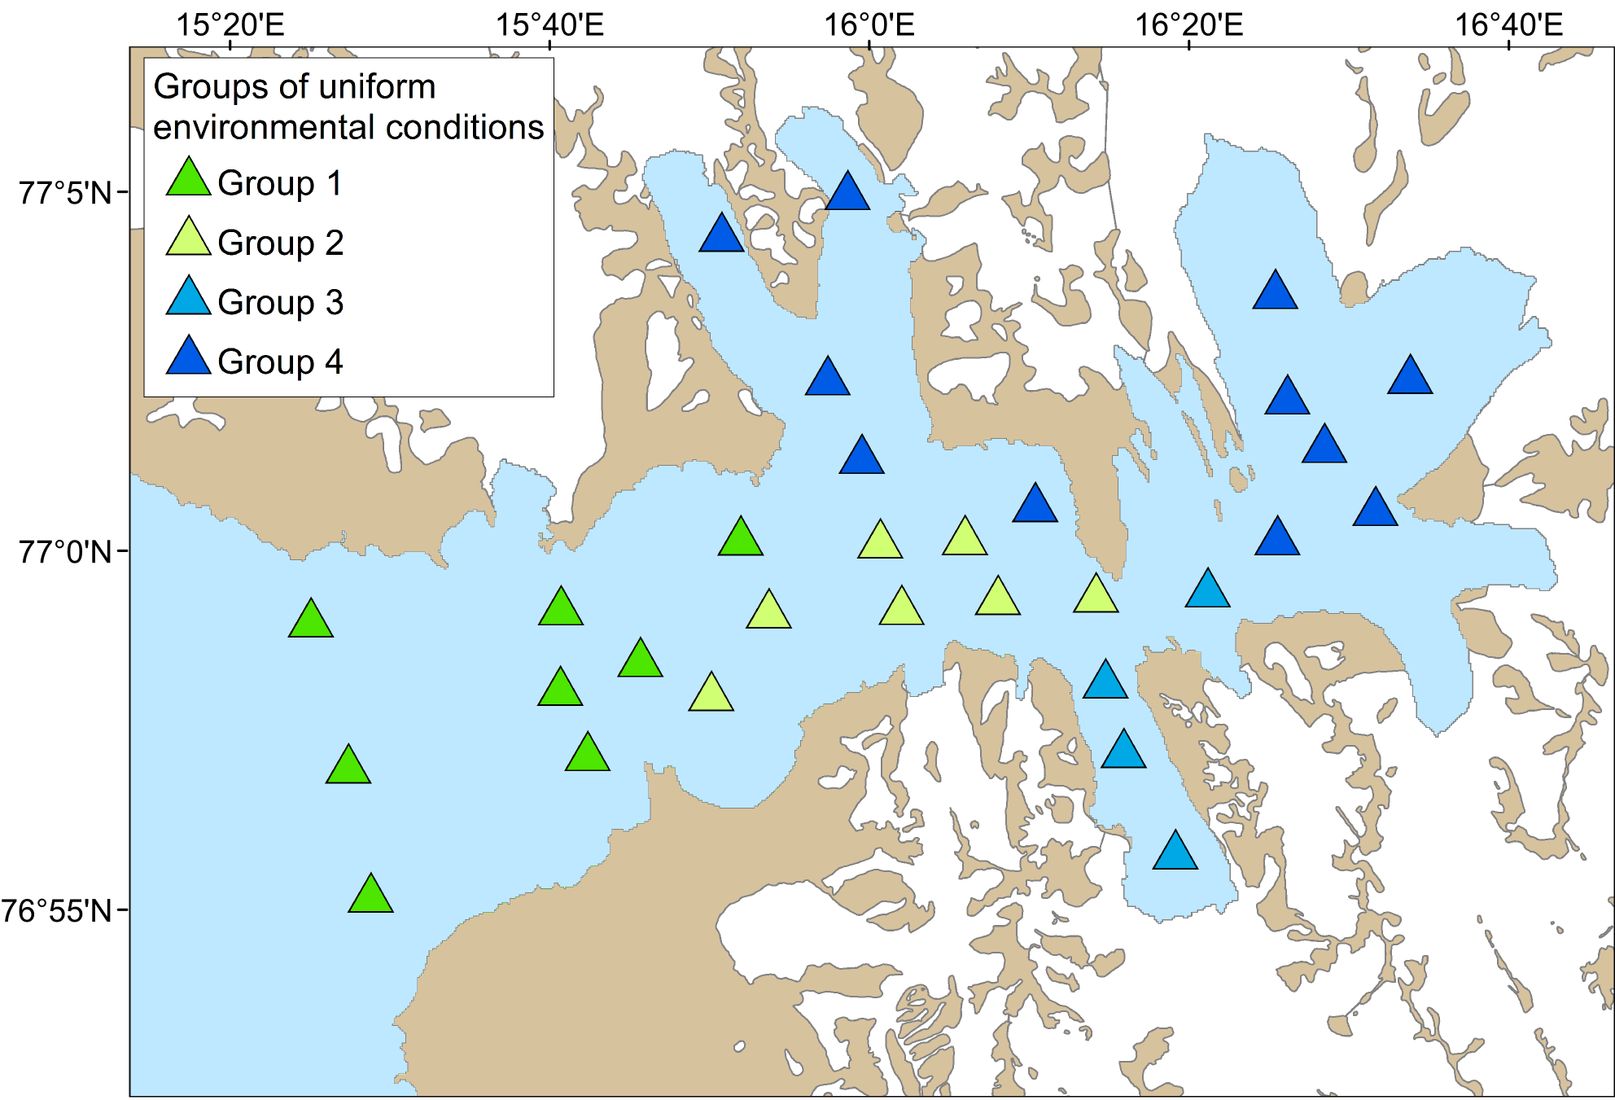 Fig. 8 Classes of uniform sea bed conditions (based on organic carbon content and chlorophyll a concentration in sediments, mean grain size of sediments, mineral matter sedimentation rates, depth, near-bottom water temperature and salinity). |
| Published article |
II. Species Distribution Modelling of benthic macrofauna in the Hornsund fjord (Spitsbergen, Svalbard)
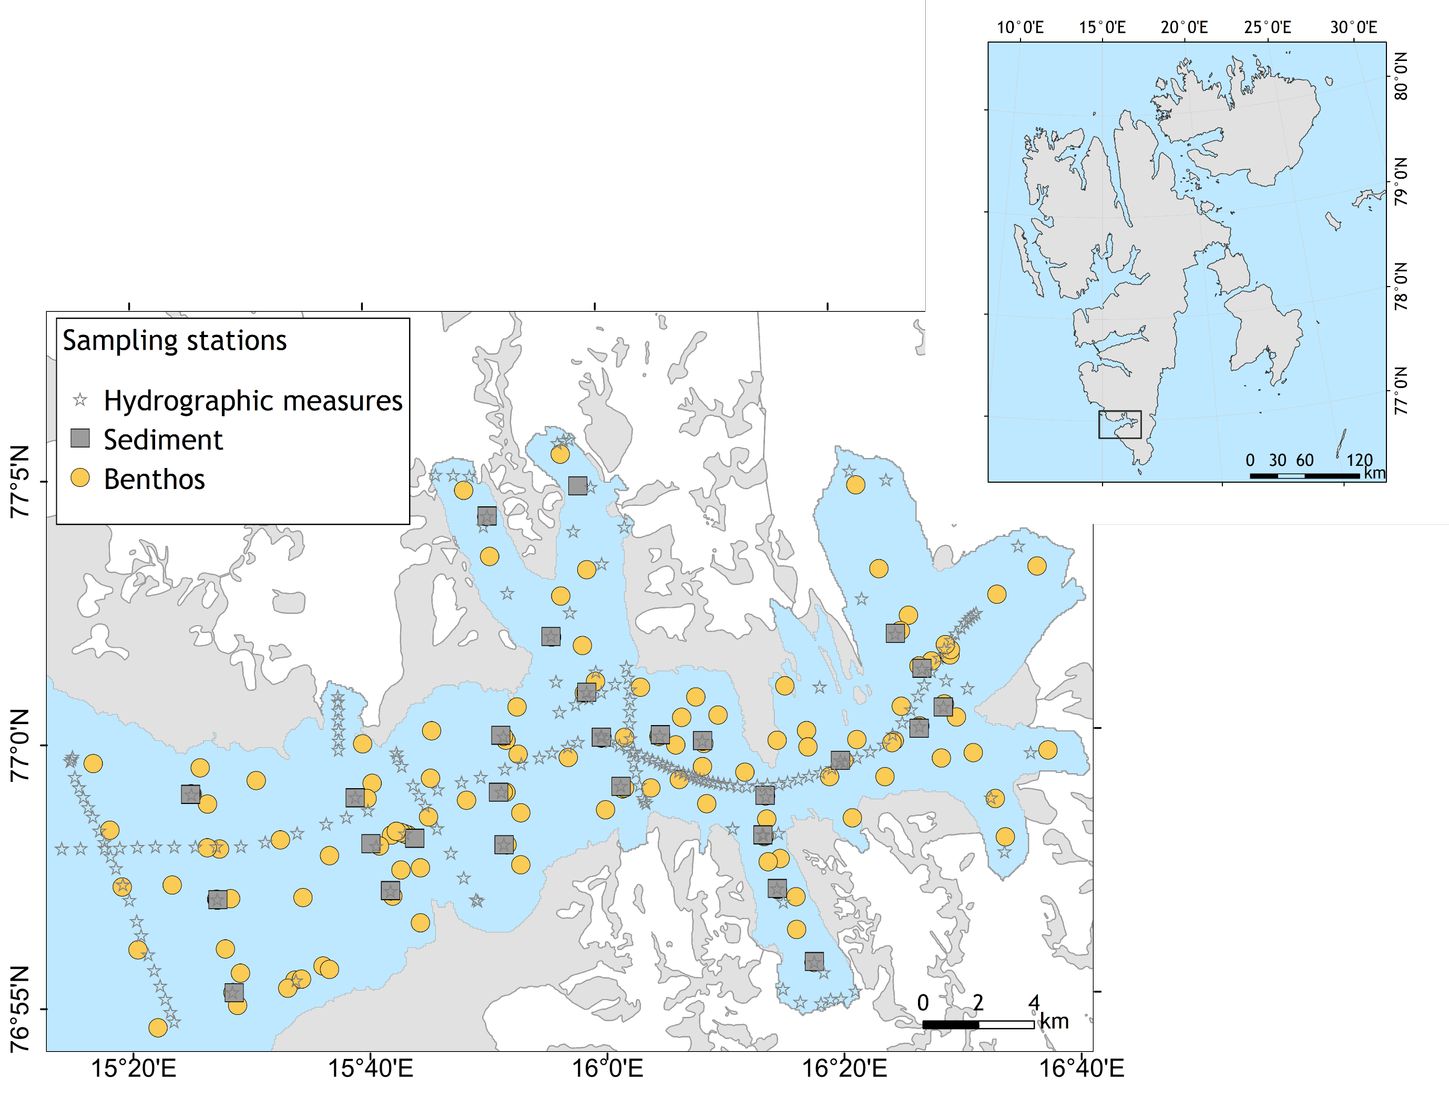 Fig. 1 Study area and locations of sampling stations. Circles indicate benthos sampling locations; squares represent sediment collection sites and stars indicate hydrographic measurements. |
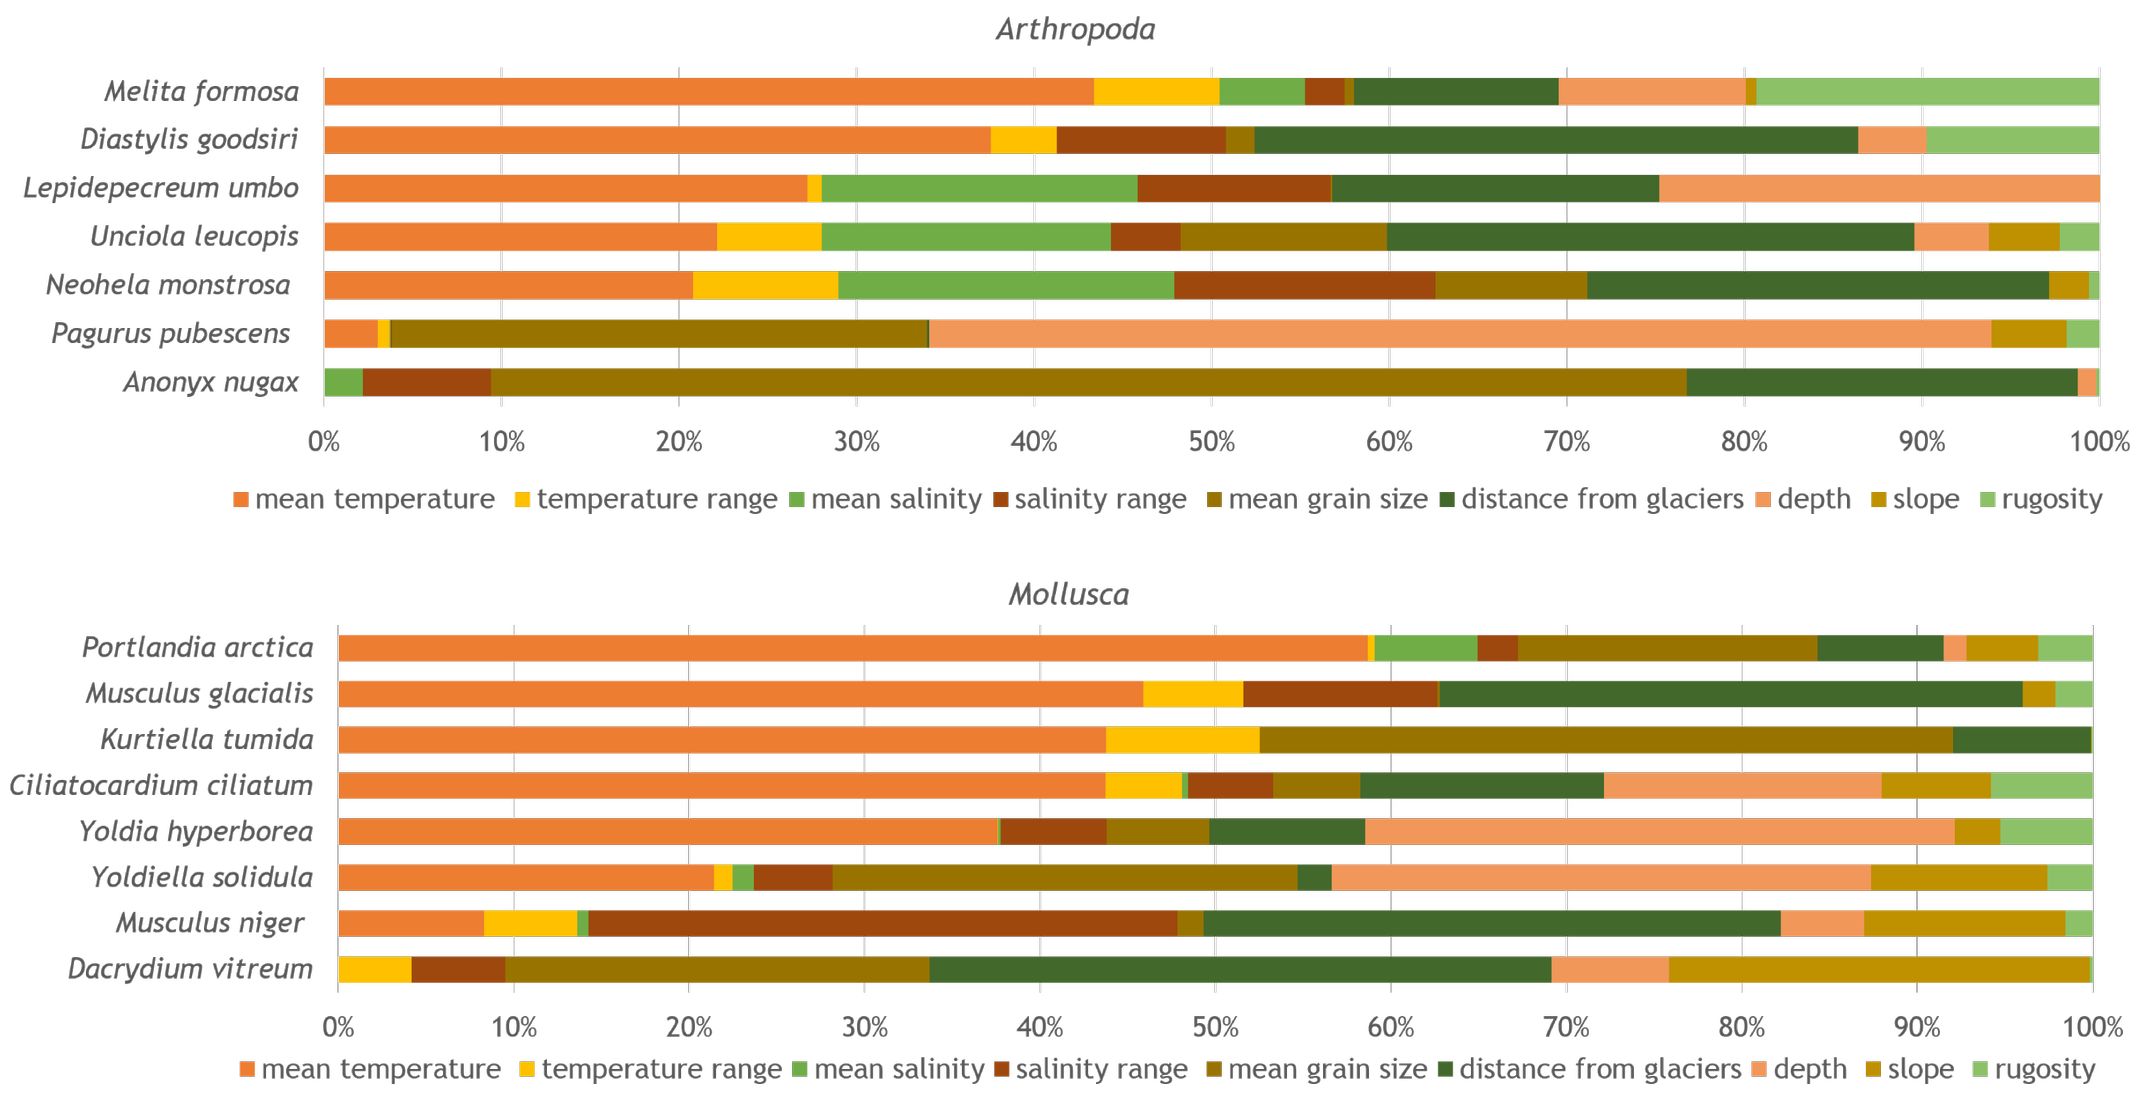 Fig. 2 Environmental factors potentially affecting benthic species collected in the Hornsund fjord and those factors' percent contribution to species distribution, as determined in the Maxent models. |
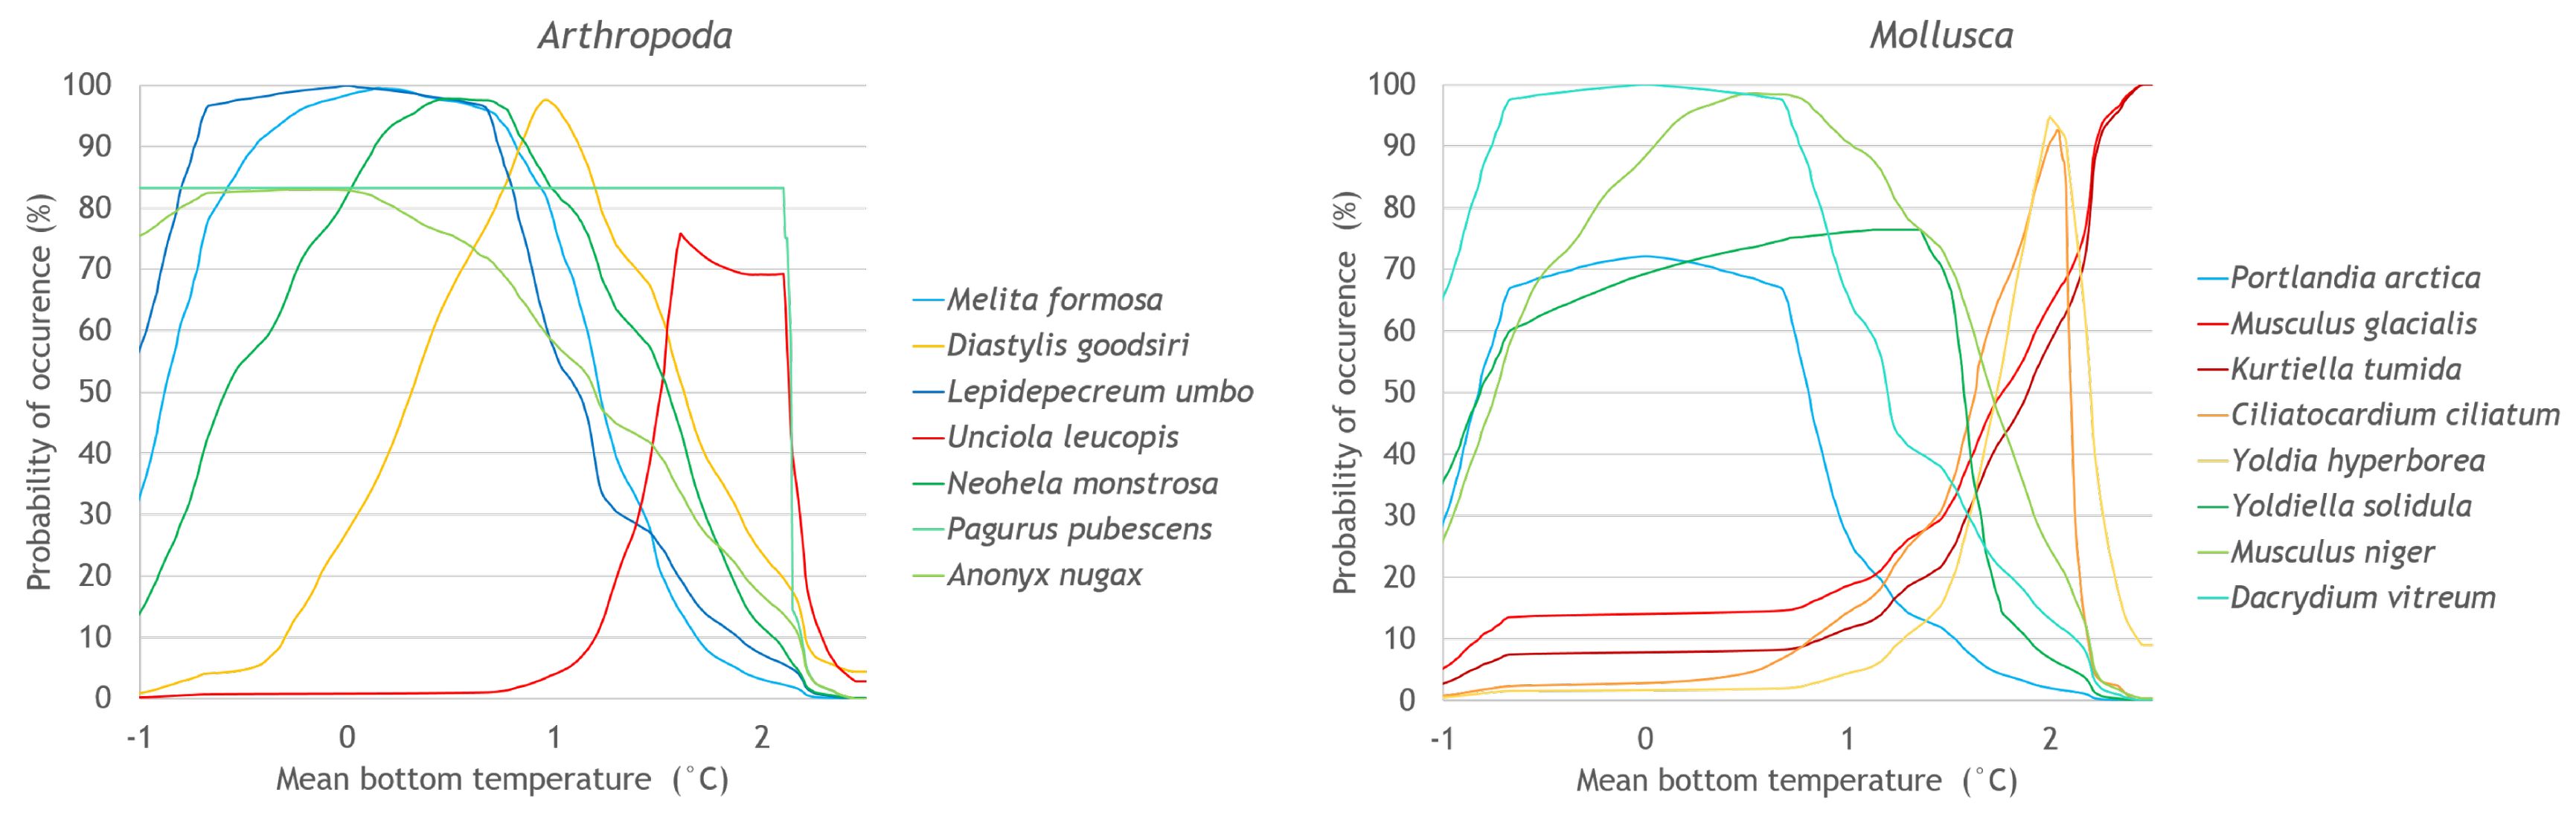 Fig. 3 Response curves of benthic species collected in the Hornsund fjord to mean bottom water temperature (derived in Maxent). |
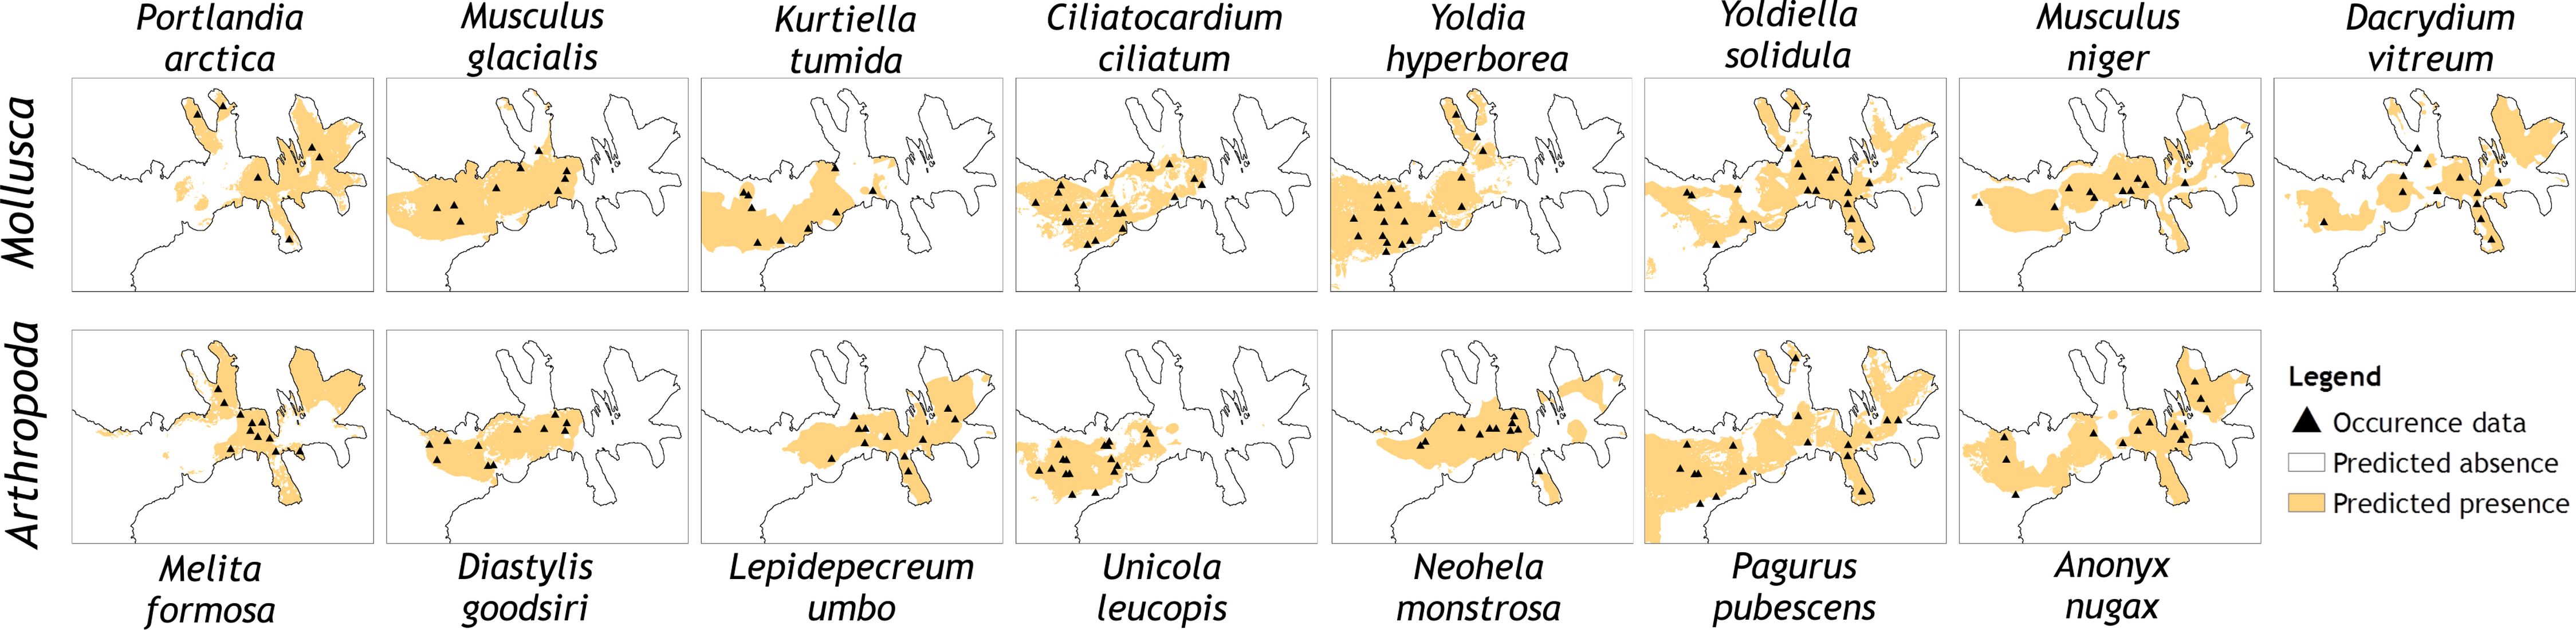 Fig. 4 Modelled distributions for selected benthic species collected in Hornsund fjord; modelled using Maxent and applying LPT-the lowest presence threshold. Predicted areas are shaded; locations of observed occurrences are shown as black triangles. |
![]()